
Geometric Visualization of a Complex Fibonacci Sequence
Loading the math board and drawing, please wait…
In collections
complex-numbers
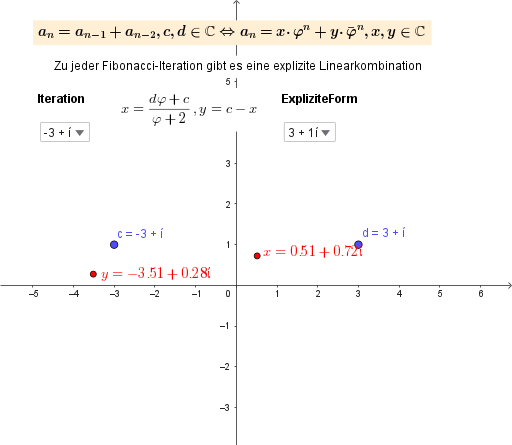
This example demonstrates how iterating a complex-valued Fibonacci-type recurrence can be visualized on the plane, revealing the evolving structure of the sequence elements and related geometric quantities. The core ideas are complex numbers (represented as planar points/vectors), Fibonacci-style recursion implemented through iterative sequence generation (IterationList, Sequence), and the use of key constants/ratios (e.g., parameters like φ and related values such as phi1) to drive geometric relationships. Construction-wise, it uses GeoGebra’s IterationList and Sequence to generate the complex sequence data (objects such as c, d, phi, phi1, and the coordinates xx, yy), while Text objects (Text1–Text5) annotate key parameters. Additional drawable elements (e.g., F1 and F2) are used to display derived functions/curves or other intermediate geometric constructs that correspond to each iteration. Suitable for advanced high-school enrichment and early university courses on complex numbers, sequences/recurrences, and dynamic math visualization.
GeoGebra Commands & Parameters
IterationList(a + b, a, b, {c, d}, 20) → F1Sequence((xx * phi^(k)) + (yy * phi1^(k)), k, 1, 20) → F2
AI Drawing Prompt Reference
Draw a geometric visualization of a complex Fibonacci sequence, first generate a complex sequence, then plot a spiral curve using the elements of the sequence to show the evolution of the Fibonacci sequence on the complex plane.
The prompt above was compiled from the original drawing commands and is for reference only.