
Geometric explanation of the e^{ix} power series (complex numbers)
Loading the math board and drawing, please wait…
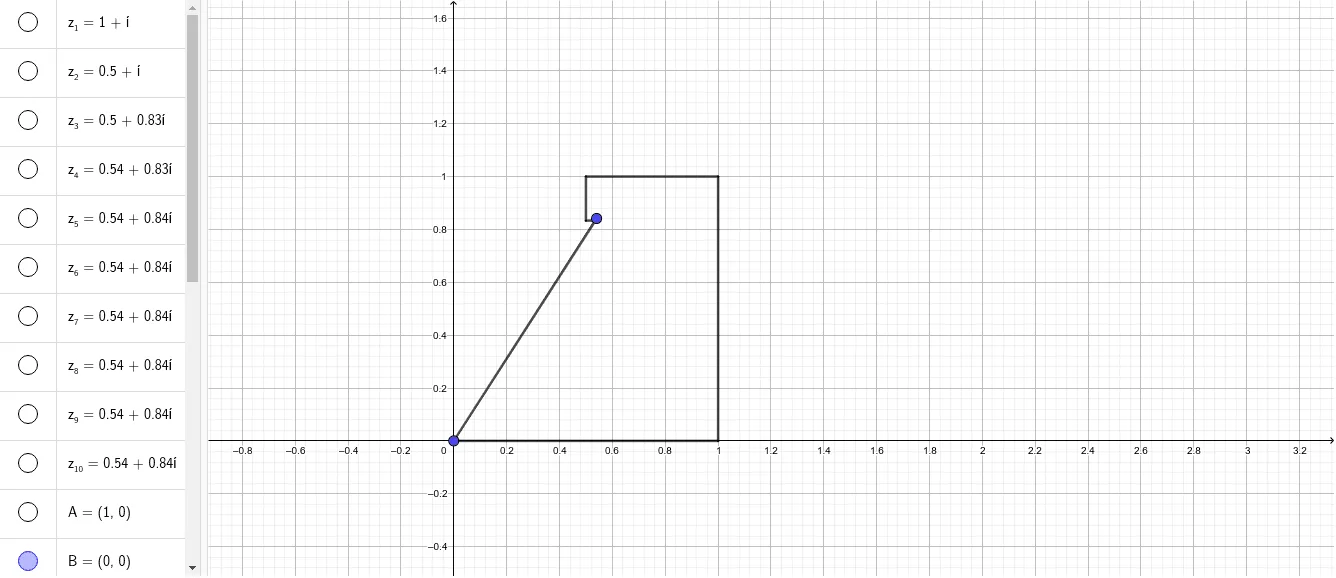
This example visualizes the relationship between the complex exponential e^{ix} and its power-series expansion by building a geometric/complex-plane construction that shows how partial sums accumulate toward the target value. The key ideas are complex numbers, the meaning of e^{ix} for angles, and the power series viewpoint (Euler-formula intuition connecting complex exponentials with trigonometric behavior). Construction-wise, it uses the GeoGebra command “Segment” to draw a polyline formed by points z_1 through z_10, representing successive terms or partial sums in the series. Additional objects A, B, and C serve as reference points, while labeled objects f, g, h, i, j, k, l, m, n, p, q organize the intermediate quantities or geometric components used to place those points in the complex plane. The step-by-step, term-by-term geometry makes it suitable for learning, classroom demonstration, and early university preparation for complex analysis or advanced calculus.
GeoGebra Commands & Parameters
Segment(B, A) → fSegment(A, z_1) → gSegment(z_1, z_2) → hSegment(z_2, z_3) → iSegment(z_3, z_4) → jSegment(z_4, z_5) → kSegment(z_5, z_6) → lSegment(z_6, z_7) → mSegment(z_7, z_8) → nSegment(z_8, z_9) → pSegment(B, z_{10}) → q
AI Drawing Prompt Reference
Visualize the relationship between the complex exponential e^{ix} and its power series expansion in the complex plane. Draw a polyline connecting points B to A, then sequentially connecting z_1 through z_10, representing successive partial sums accumulating toward the target value. Include reference point B and intermediate points z_1 to z_10, with line segments linking them to illustrate the term-by-term addition in the series, highlighting the connection between complex exponentials and trigonometric behavior.
The prompt above was compiled from the original drawing commands and is for reference only.