
Geometric explanation of e^{i} using limits in the complex plane
Loading the math board and drawing, please wait…
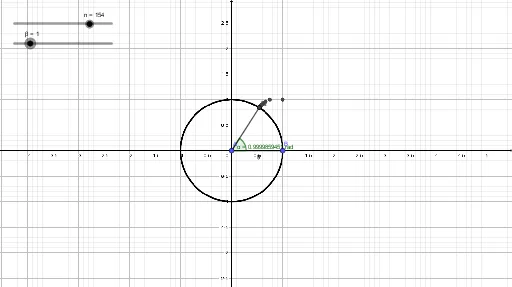
This example visualizes how a limit-based explanation connected to e^{iθ} can be understood geometrically in the complex plane. It highlights the continuity behavior of the complex exponential: as a parameter varies toward its target value, the corresponding construction (especially the phase/angle information) converges, producing a consistent geometric picture. Key concepts include complex numbers via polar form, the complex extension of the exponential function (Euler-type rotation: e^{iθ}), continuity, and the role of limits in preserving geometric structure under refinement. Construction-wise, the GeoGebra setup uses commands such as Segment and Angle together with objects n, z_1, c, a, A, f, B, g, α, β, and z_2. Segments are used to build the relevant geometric relations, while Angle measures phase angles (α, β) that connect the plotted complex points z_1 and z_2 to the underlying exponential/rotation interpretation. Suitable for upper-secondary through early undergraduate audiences for teaching complex numbers, functions, and intuitive limit/continuity reasoning through visualization.
GeoGebra Commands & Parameters
Segment(A, z_1) → fSegment(A, B) → gAngle(B, A, z_1) → α
AI Drawing Prompt Reference
Draw a unit circle in the complex plane with point A as the starting point. Draw two vectors f and g representing complex numbers z1 and z2. Draw angle α through point A and z1 to indicate the angle of z1 in the complex plane.
The prompt above was compiled from the original drawing commands and is for reference only.