
Venn Diagram Example by Dr Brooks (4)
Loading the math board and drawing, please wait…
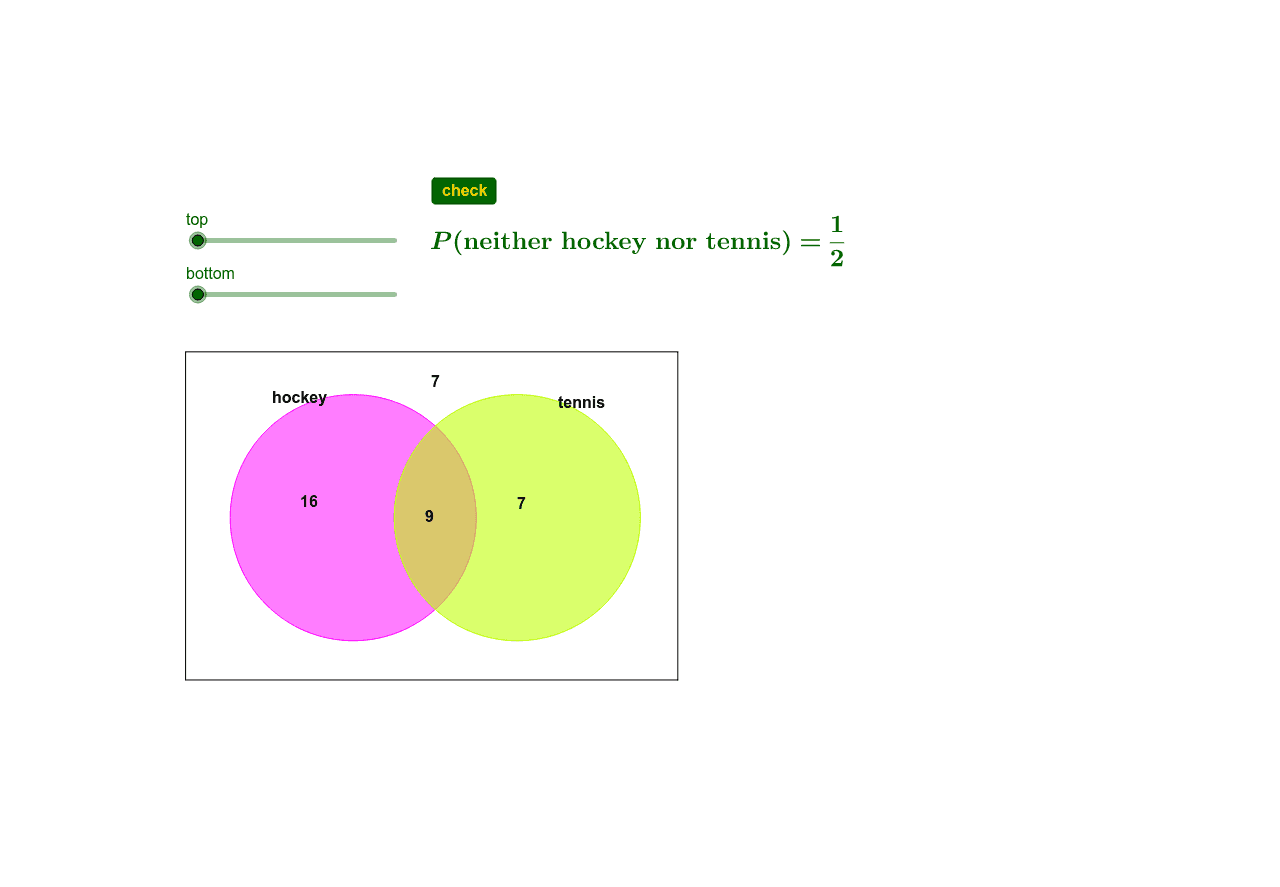
This example demonstrates the creation of a Venn diagram, involving set concepts. Using GeoGebra commands such as Polygon, Point, Circle, etc., the intersection, union, and complement of sets can be clearly illustrated. Suitable for students at junior high school level and above to learn set theory and probability statistics.
GeoGebra Commands & Parameters
Polygon(B, C, D, A) → poly1, b, c, d, aPoint(xAxis) → ESegment(F, G) → eCircle(E, e) → fPoint(xAxis) → H_1Circle(H_1, e) → gIf(GCD[top, bottom] ≟ 1, "", "=" + (FractionText[top / bottom])) → question1
AI Drawing Prompt Reference
Draw a Venn diagram with two intersecting circles to represent sets A and B. Mark the centers E and H on the x-axis, and draw circles with E and H as centers and the length of segment FG as the radius. Shade the area where the two circles intersect.
The prompt above was compiled from the original drawing commands and is for reference only.