
Venn Diagram Example by Dr Brooks (10)
Loading the math board and drawing, please wait…
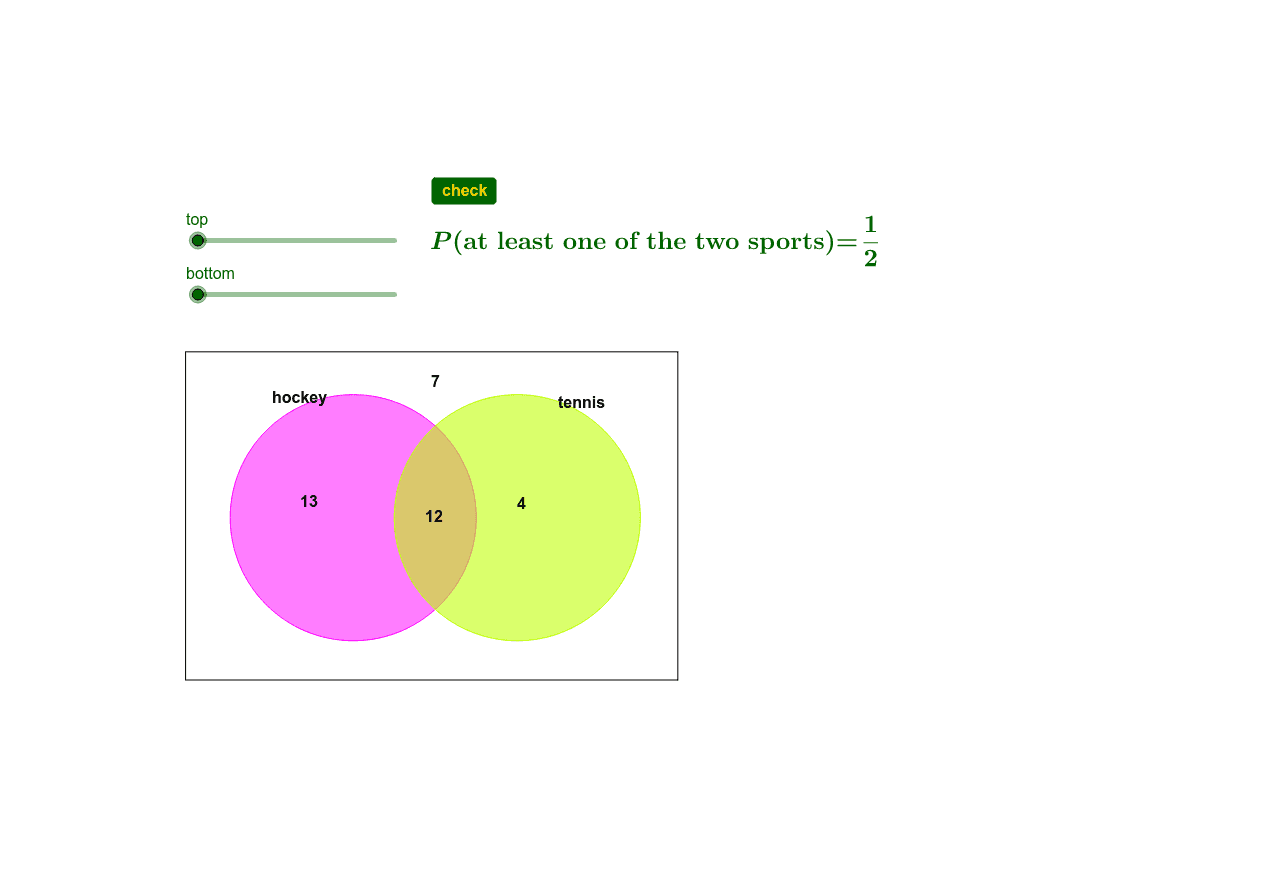
This example demonstrates how to use Venn diagrams to represent relationships between sets. The math concepts involved include set theory, union, intersection, and complement. It is constructed using GeoGebra commands/objects like Polygon, Point, Segment, Circle, and If. Suitable for high school mathematics or discrete mathematics courses to teach set operations and visualization.
GeoGebra Commands & Parameters
Polygon(B, C, D, A) → poly1, b, c, d, aPoint(xAxis) → ESegment(F, G) → eCircle(E, e) → fPoint(xAxis) → H_1Circle(H_1, e) → gIf(GCD[top, bottom] ≟ 1, "", "=" + (FractionText[top / bottom])) → question1
AI Drawing Prompt Reference
Draw a Venn diagram with three circles. The first circle is in the center, the second on the left, and the third on the right. The boundaries of each circle are defined by line segments, and the centers are on the horizontal axis. The circles overlap to show intersection and union of sets. Construct by drawing the center circle first, then the left and right circles, and finally the overlapping regions.
The prompt above was compiled from the original drawing commands and is for reference only.