
Probability Venn Diagram: Circle
Loading the math board and drawing, please wait…
In collections
Probability Venn Diagrams
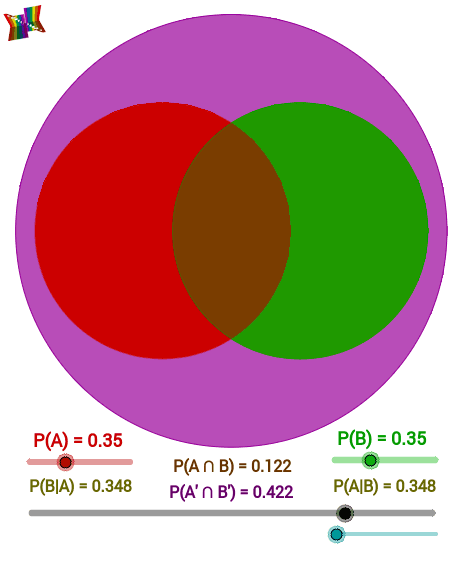
This is a probability Venn diagram with proportionally-sized regions, demonstrating probability distribution within a circle. The example involves core concepts of probability and statistics. It is constructed using GeoGebra commands such as Line, Circle, Segment, etc. Suitable for high school and above students or teachers for teaching and learning probability and statistics.
GeoGebra Commands & Parameters
Line(A, B) → cCircle(C, r1) → gCircle(D, r2) → eSegment(C, D) → distIf(x(D) - x(C) ≤ r1 - r2, Min[a, b], r1^(2) * θ + r2^(2) * α - h * ((r1^(2) - h^(2))^(0.5) + (r2^(2) - h^(2))^(0.5))) → intersection1If(x(D) - x(C) ≤ r2 - r1, Min[a, b], r1^(2) * θ + r2^(2) * α - h * ((r1^(2) - h^(2))^(0.5) + (r2^(2) - h^(2))^(0.5))) → intersection2If(r2 + r1 < x(D) - x(C), 0, If[r2 ≥ r1, intersection2, intersection1]) → IntersectAreaMidpoint(C, D) → EPolygon((x(E) - φ^(0.5) / 2, y(E) - 1 / (2 * φ^(0.5))), (x(E) - φ^(0.5) / 2, y(E) + 1 / (2 * φ^(0.5))), (x(E) + φ^(0.5) / 2, y(E) + 1 / (2 * φ^(0.5))), (x(E) + φ^(0.5) / 2, y(E) - 1 / (2 * φ^(0.5)))) → poly1, f, i, j, kCircle(D, r2) → pCircle(E, 0.5641895835477563) → qIf(logooff < 4.5, 0, 2 * (logooff - 4.5)) → logooffopa
AI Drawing Prompt Reference
Draw a probability Venn diagram inside a circle, including two intersecting circles where the center of one lies on the circumference of the other. Start by drawing a line, then create two circles of different sizes with their centers at specified points. Draw a line connecting the intersection points of the circles, calculate the area of the intersection, and finally draw a quadrilateral near the intersection points to represent the probability distribution area.
The prompt above was compiled from the original drawing commands and is for reference only.