
Polynomial Function Generator
Loading the math board and drawing, please wait…
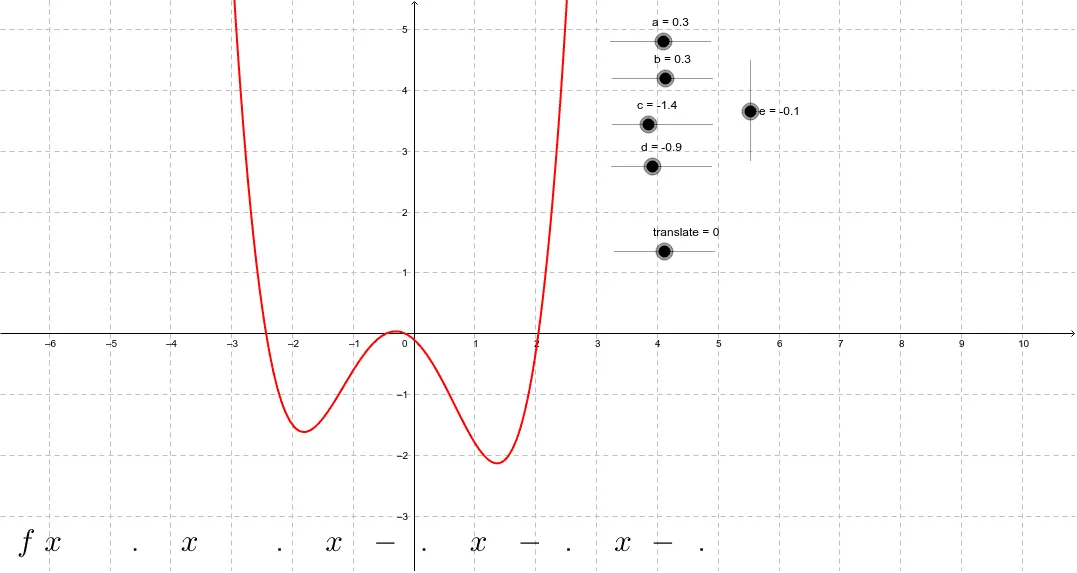
This example demonstrates how to generate polynomial functions and visualize their graphs. Core math concepts include polynomial functions, function graphs, and parameter adjustment. Construction highlights: utilizes GeoGebra commands/objects a, b, c, d, e, translate, f, text1, where a-e are parameters, translate for translation, f generates the function, and text1 displays information. Suitable for high school mathematics teaching, particularly in calculus and analytical geometry courses for polynomial function studies.
GeoGebra Commands & Parameters
Numeric a(0.3)Numeric b(0.3)Numeric c(-1.4)Numeric d(-0.9)Numeric e(-0.1)Numeric translate(0.0)f(x) = a * (x - translate)^(4) + b * (x - translate)^(3) + c * (x - translate)^(2) + d * (x - translate) + e
AI Drawing Prompt Reference
Draw a quartic polynomial function graph with parameters a=0.3, b=0.3, c=-1.4, d=-0.9, e=-0.1, and x-axis translation of 0. Observe how the graph changes by adjusting these parameters.
The prompt above was compiled from the original drawing commands and is for reference only.