
Change of Sign: Decimal Search
Loading the math board and drawing, please wait…
In collections
A Level: Numerical Methods for Solving Equations
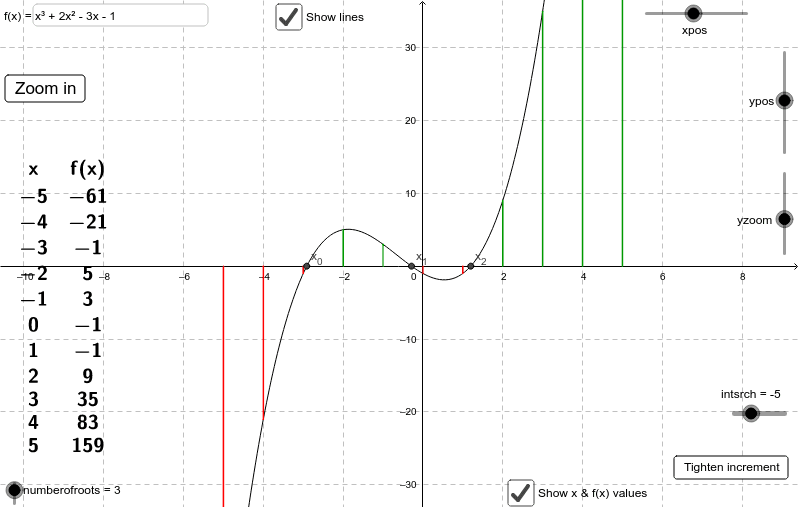
This example demonstrates the Decimal Search method for identifying the existence of roots in a continuous function. It involves core mathematical concepts like the Intermediate Value Theorem, interval bisection, and confidence intervals for roots. GeoGebra commands used include Intersect, Element, Textfield, If, Segment, and TableText for constructing the visualization. Suitable for high school students studying numerical methods, particularly for MEI C3 coursework.
GeoGebra Commands & Parameters
Intersect(f, g) → x_0, x_1, x_2, x_3Element(rootlist, rootnumber) → rootTextfield(f) → inputBox1Element(xmaxlist, zoomnumber) → xmaxElement(xminlist, zoomnumber) → xminElement(yzoomadjustlist, zoomnumber) → yzoomadjustIf(level2increment < 1, clevervalue, intsrch) → startsearchvalueSegment((A13, 0), (A13, B13)) → C13Segment((A13, 0), (A13, B13)) → D13Segment((A14, 0), (A14, B14)) → C14Segment((A15, 0), (A15, B15)) → C15Segment((A16, 0), (A16, B16)) → C16Segment((A17, 0), (A17, B17)) → C17Segment((A18, 0), (A18, B18)) → C18Segment((A19, 0), (A19, B19)) → C19Segment((A20, 0), (A20, B20)) → C20Segment((A21, 0), (A21, B21)) → C21Segment((A22, 0), (A22, B22)) → C22Segment((A23, 0), (A23, B23)) → C23Segment((A14, 0), (A14, B14)) → D14Segment((A15, 0), (A15, B15)) → D15Segment((A16, 0), (A16, B16)) → D16Segment((A17, 0), (A17, B17)) → D17Segment((A18, 0), (A18, B18)) → D18Segment((A19, 0), (A19, B19)) → D19Segment((A20, 0), (A20, B20)) → D20Segment((A21, 0), (A21, B21)) → D21Segment((A22, 0), (A22, B22)) → D22Segment((A23, 0), (A23, B23)) → D23TableText(matrix1, "cc") → text3
AI Drawing Prompt Reference
Draw the graph of a continuous function and use the decimal search method to find its roots. First, mark several intervals on the x-axis and represent the search process in each interval with vertical line segments from the x-axis to the function graph. Then, label the midpoints of each interval with colored line segments and indicate the roots of the function. Finally, add text annotations next to the graph to explain the steps and principles of the decimal search method, including the Intermediate Value Theorem and interval bisection.
The prompt above was compiled from the original drawing commands and is for reference only.