
Using Tangent Gradient to Sketch the Derivative
Loading the math board and drawing, please wait…
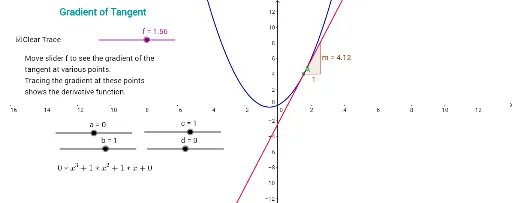
This example demonstrates how to use the gradient (slope) of tangents to a curve to sketch the shape of the derivative function. It highlights the geometric meaning of the derivative: at each chosen point, the tangent’s slope equals the derivative value there, and the collection of these slope values outlines the derivative’s graph trend. Key concepts include derivative as a limit-based slope, tangent line geometry, and the relationship between a function’s graph and its derivative. In GeoGebra, the construction centers on creating a tangent line with Tangent and obtaining its slope via Slope, then mapping those slope values against the corresponding x-positions to form a sketch-like derivative curve. The provided construction uses the core objects and display elements such as Tangent/Slope and multiple labeled items (e.g., points, function f, measurement m, and text/graphics objects) to guide visualization and interpretation. Suitable for calculus instruction, derivative intuition, and graphing-focused learning for advanced high school and early university students.
GeoGebra Commands & Parameters
Tangent(A, f_1) → eSlope(e) → m
AI Drawing Prompt Reference
Draw a function f, then select several points on it. For each point, draw a tangent line and measure its slope. Plot these slope values against their corresponding x-coordinates to form a sketch-like graph of the derivative function.
The prompt above was compiled from the original drawing commands and is for reference only.