
Visualizing the Derivative via Tangent Line Slope
Loading the math board and drawing, please wait…
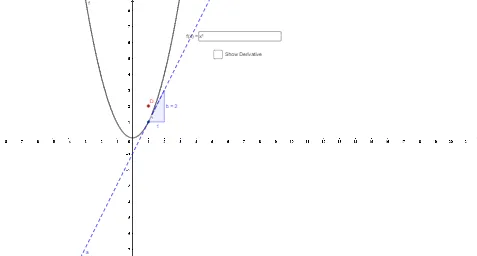
This example demonstrates how the derivative of a function can be understood geometrically by selecting a point on the curve and drawing the tangent line at that point. It highlights the key idea that the derivative equals the tangent line’s slope, i.e., the function’s instantaneous rate of change. The core concepts involved are tangents, slope (rate of change), and local linear approximation of a curve. Construction uses GeoGebra commands and objects from the provided summary: Point to define points on the function and control locations (e.g., A, D and related points); Tangent to create the tangent line at the chosen point; Slope to compute and display the tangent’s slope; and Textfield / InputBox1 to input or adjust function parameters and the interactive variable (e.g., f, a, b, c, g), making the tangent update dynamically. Suitable for high-school advanced calculus foundations and introductory university calculus classes, as well as interactive demonstrations and learning-by-exploration activities.
GeoGebra Commands & Parameters
Point(f) → ATangent(A, f) → aSlope(a) → bTextfield(f) → InputBox1
AI Drawing Prompt Reference
Draw a function curve with a movable point on it. At that point, construct the tangent line to the curve and display the slope value of this tangent. Provide an input box to adjust parameters in the function expression, so that the curve and tangent update dynamically. The figure should emphasize the local coincidence of the tangent with the curve at the point, visually demonstrating that the derivative equals the tangent's slope.
The prompt above was compiled from the original drawing commands and is for reference only.