
Visualizing Function Limits
Loading the math board and drawing, please wait…
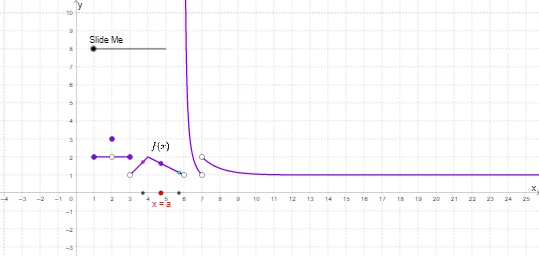
This example uses dynamic graphics to illustrate the concept of function limits. Key mathematical concepts include function limits. Construction highlights include the use of points, vectors, and functions in GeoGebra. Suitable for high school math education to help students intuitively understand the definition of limits.
GeoGebra Commands & Parameters
Point(xAxis) → DVector((x(D), 0), (x(D), f(x(D)))) → uVector((x(D), f(x(D))), (0, f(x(D)))) → v
AI Drawing Prompt Reference
Create a dynamic illustration to demonstrate the concept of function limits, featuring a point on the x-axis, a vector from this point pointing to the function's value at that point and to the origin, and another vector from the function's value point to the origin, using these dynamic elements to intuitively show the definition of limits.
The prompt above was compiled from the original drawing commands and is for reference only.