
Using the Mean to Find the Mode of a Binomial Distribution
Loading the math board and drawing, please wait…
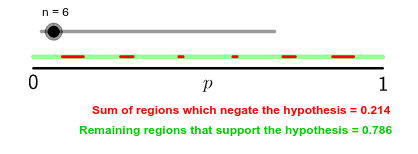
This example demonstrates how to use the mean to find the mode of a binomial distribution. Key math concepts involved include binomial distribution, mode, mean, and standard deviation. The construction uses GeoGebra commands Sequence and Segment, with objects like n, a, list3, list2, b, text1, text2, totalred, text3, d, c, totalgreen, text4, and text5. Suitable for high school and above students to understand the properties of binomial distribution and the relationship between mean and mode.
GeoGebra Commands & Parameters
Sequence(Segment[(3 - (3 * (r - 0.5) / n), a), (3 - (3 * r / (n + 1)), a)], r, 1, n / 2, 1) → list3Sequence(Segment[((3 * (r - 0.5) / n), a), ((3 * r / (n + 1)), a)], r, 1, n / 2, 1) → list2Segment((0, b), (3, b)) → dSegment((0, b - 0.1), (3, b - 0.1)) → c
AI Drawing Prompt Reference
Draw a diagram showing how to use the mean to find the mode of a binomial distribution, including a horizontal line segment from 0 to 3, with two sets of parallel line segments extending from both ends, forming a symmetric distribution shape, connected by short lines to represent different probability values, and labeled with text to indicate the relationships between the mean, mode, and standard deviation.
The prompt above was compiled from the original drawing commands and is for reference only.