
Unit Circle and Sine Graph Dynamic Generation
Loading the math board and drawing, please wait…
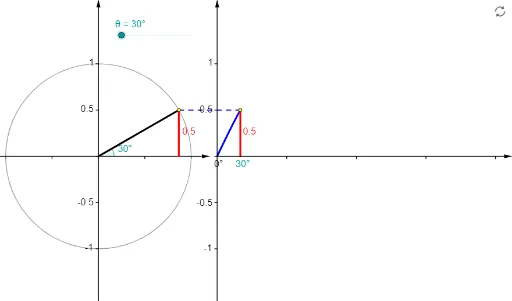
This GeoGebra example dynamically generates the sine graph from the unit circle, showing how the y-coordinate of a point rotating on the unit circle maps to the sine function curve. It covers core concepts such as the unit circle, radian measure, the definition of sine, and its periodic nature. The construction uses commands like Point, Rotate, Angle, Function, Segment, Circle, Vector, and Sequence to build the circle, rotating angle, sine curve, and auxiliary segments with text labels. By animating the angle θ, learners can visually connect the point's vertical position on the circle to the corresponding point on the sine wave. Ideal for high school trigonometry lessons and introductory college mathematics, this interactive tool strengthens the link between geometric visualization and function graphing.
GeoGebra Commands & Parameters
Point(Ray[(0, 0), (-1, 0)]) → BRotate(A, θ, B) → PRotate(A, θ, B) → A'Angle(A, B, A') → αRotate(A, θ, B) → A'_1Angle(A, B, A'_1) → βFunction(sin((120° * x)), 0, x(Q)) → fSegment(Q, (x(Q), 0)) → eCircle(B, A) → cSegment(B, P) → aVector((x(B), y(Corner[1])), (x(B), y(Corner[4]))) → uVector((0, y(Corner[1])), (0, y(Corner[4]))) → wVector((0, 0), (x(Corner[2]), 0)) → zSequence(Segment[((0.75 * i), 0), ((0.75 * i), -0.025)], i, 1, 4) → list1Segment(P, (x(P), 0)) → bVector(B - (1.2, 0), B + (1.2, 0)) → vSequence(Segment[(0, (0.5 * i) - 1), (-0.025, (0.5 * i) - 1)], i, 0, 4) → list2Sequence(Segment[(x(B), (0.5 * i) - 1), (x(B) - 0.025, (0.5 * i) - 1)], i, 0, 4) → list3Segment(P, Q) → dSequence(Segment[B + ((0.5 * i) - 1, 0), B + ((0.5 * i) - 1, -0.025)], i, 0, 4) → list4Point(Ray[(0, 0), (-1, 0)]) → B_1Rotate(A_1, θ, B_1) → P_1Rotate(A_1, θ, B_1) → A'_2Rotate(A_1, θ, B_1) → A'_3Circle(B_1, A_1) → c_1Segment(B_1, P_1) → a_1
AI Drawing Prompt Reference
Create a dynamic illustration of a unit circle and a sine wave, showing how the y-coordinate of a point rotating on the unit circle maps to the sine function curve. Include an adjustable angle to visualize the relationship between the angle and the sine value, with auxiliary segments and text labels to mark key positions and values, helping to understand the geometric meaning and periodicity of the sine function.
The prompt above was compiled from the original drawing commands and is for reference only.