
Unit Circle and Sine Graph by Tim Regan
Loading the math board and drawing, please wait…
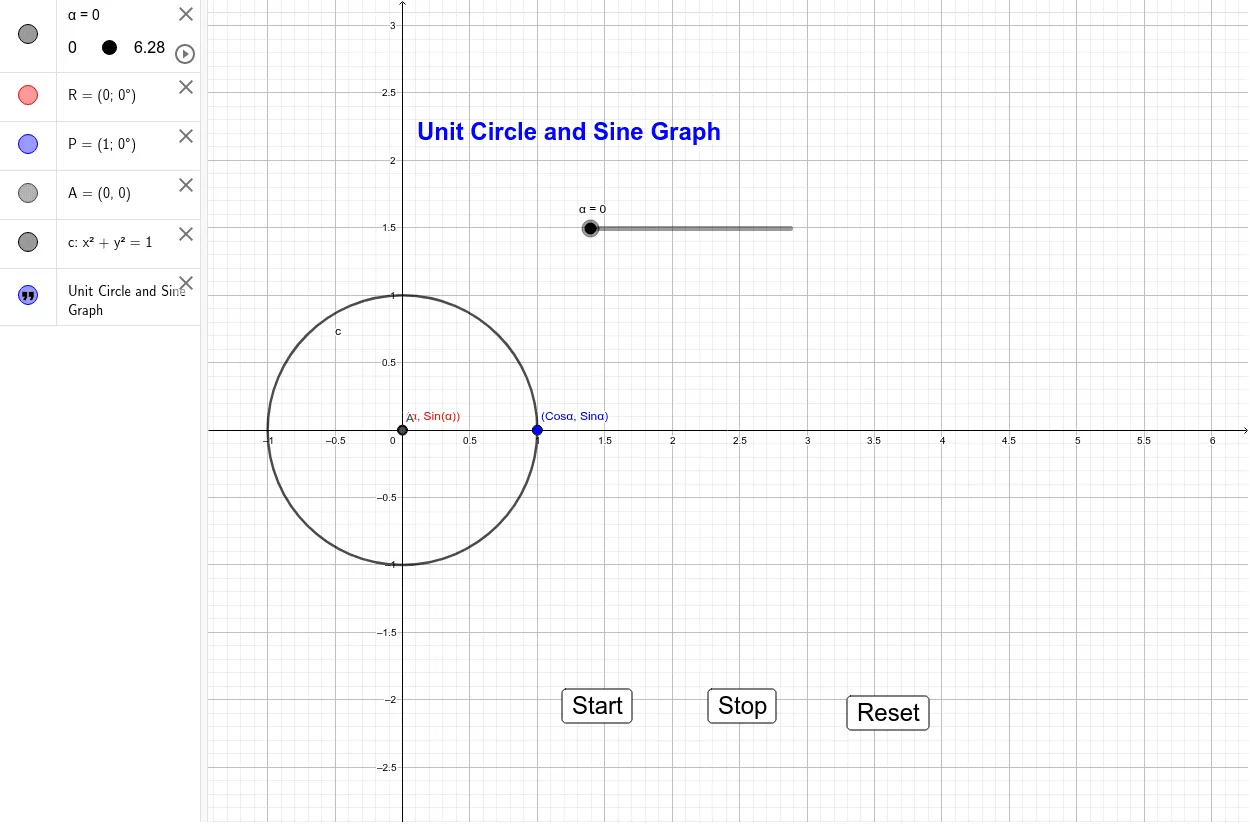
① This example dynamically demonstrates how the sine function graph is generated from a point moving on the unit circle, linking angle to function value. ② Core math concepts include the unit circle, trigonometric functions (sine), angle and radian measure, function graphing, periodicity, and the connection between circular motion and sinusoidal curves. ③ Construction details: using GeoGebra commands such as Intersect to find circle-axis intersections, Circle to create the unit circle, sliders (e.g., α) to control the angle, buttons (button1, button2, button3) to toggle display or reset, and objects like R, P, A, c, and text1 for points, circle, and labels; the point on the circle is projected to the sine graph. ④ Suitable for high school trigonometry lessons, pre-calculus review, and dynamic demonstrations of geometric-function relationships, helping students grasp the origin and shape of the sine curve.
GeoGebra Commands & Parameters
Intersect(xAxis, yAxis) → ACircle(A, 1) → c