
Trigonometric Ratio Graphs from the Unit Circle
Loading the math board and drawing, please wait…
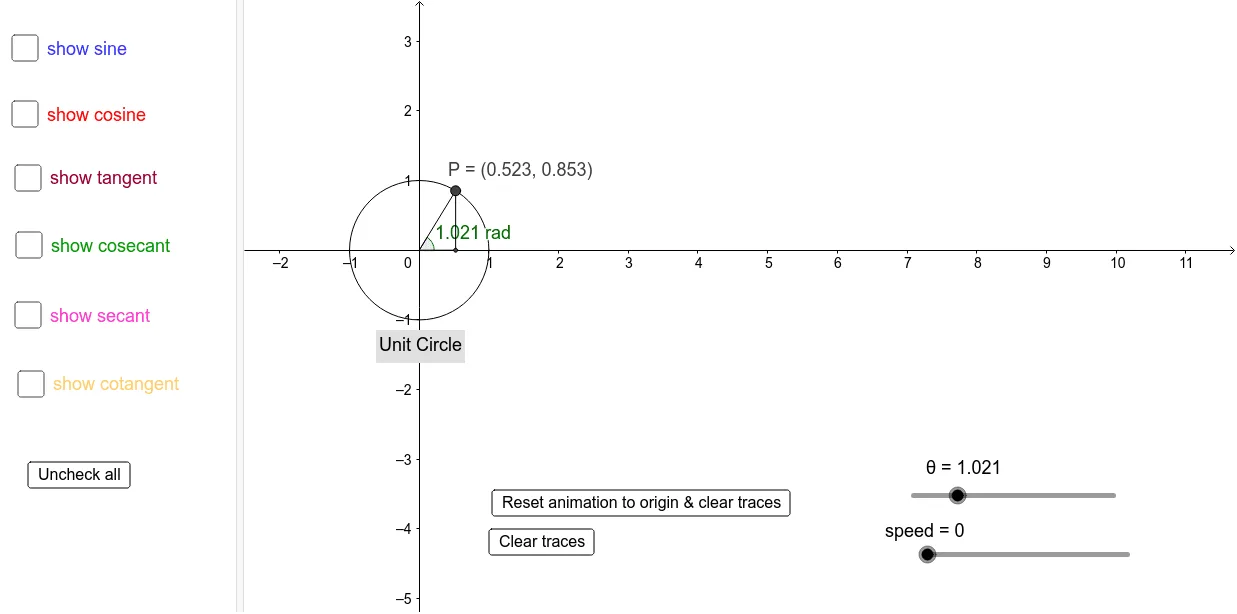
This GeoGebra example dynamically illustrates how the six trigonometric ratio graphs—sine, cosine, tangent, cosecant, secant, and cotangent—are generated from a unit circle. The core mathematical concepts include the definition of trigonometric functions via the unit circle, their periodicity, symmetry, and the relationship between angle measures and function values. The construction uses commands such as Rotate to move a point on the circle, Segment to form triangle sides, and Angle to mark θ; key objects include circle c, points A, B, P, angles θ and α, and segments d, e, f. Buttons button1 and button2 control animations that trace the graphs labeled SINE, COSINE, TANGENT, CSC, SEC, and COT. This resource is ideal for high school or introductory college students learning trigonometry, and serves as an interactive visual aid for teachers to demonstrate how the unit circle maps to function graphs, enhancing conceptual understanding of trigonometric ratios.
GeoGebra Commands & Parameters
Rotate(B, θ, A) → PSegment(A, P) → bAngle(B, A, P) → αSegment(D, P) → eSegment(A, D) → f
AI Drawing Prompt Reference
Draw a unit circle centered at the origin with a moving point on its circumference that rotates as the angle changes. From the center, draw a radius segment to this moving point, and another radius to a fixed point on the circle, forming a sector with the angle marked at the center. To the right of the circle, plot six horizontal function graphs labeled sine, cosine, tangent, cosecant, secant, and cotangent, with the horizontal axis representing angle and the vertical axis representing function values. As the point rotates, a tracing point appears on each graph, whose vertical coordinate equals the corresponding trigonometric value of the moving point, visually linking the unit circle to the function graphs.
The prompt above was compiled from the original drawing commands and is for reference only.