
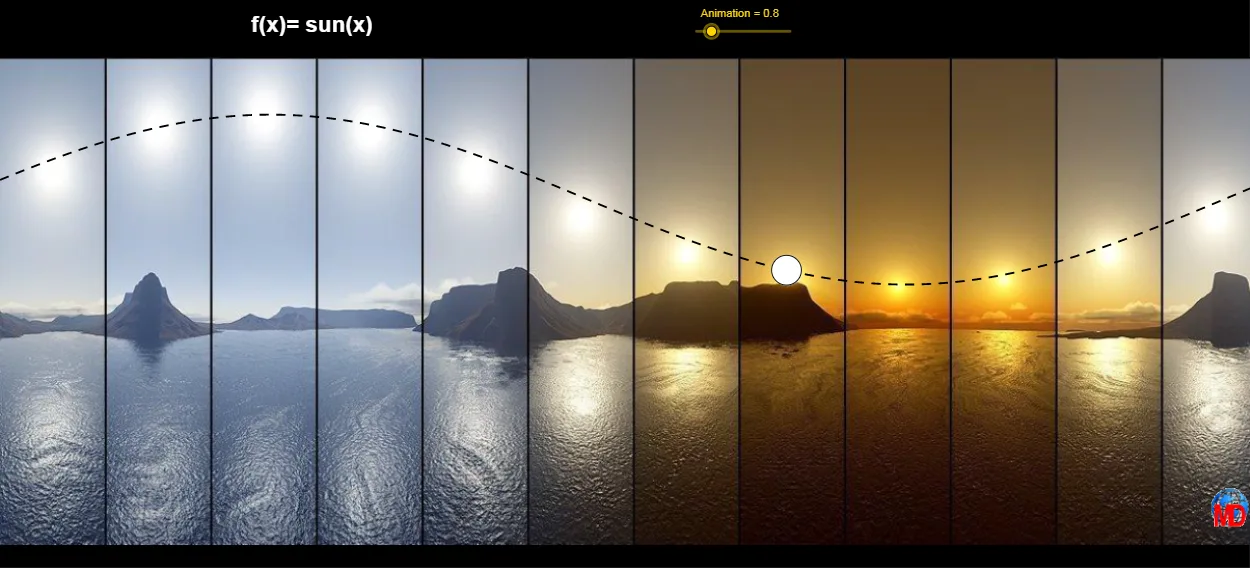
Geometric construction of the sine function sun(x) using a circle
Loading the math board and drawing, please wait…
This GeoGebra example demonstrates how the sine function (denoted as sun(x)) emerges from a circle-based geometric relationship, linking a rotating angle to the corresponding length/projection that varies periodically. It centers on core ideas of trigonometry: the sine function, periodicity, and the interpretation of trigonometric values via unit-circle (or circle) geometry, connecting geometric projections to a function graph. Construction-wise, the setup uses GeoGebra commands such as Function and Circle to define the function behavior and create the circular geometry, while multiple parameter objects (e.g., A, a, B, amp, w, b, c, f, p, t, C, d, e, g, and texte1) control inputs like angle, amplitude, and frequency. The inclusion of Animation and labeling (texte1) supports an interactive/animated view of how changing parameters updates the sine-related geometry. Suitable for middle/high school trigonometry lessons, function graphing comprehension, and classroom activities emphasizing geometric intuition.
GeoGebra Commands & Parameters
Function(f, x(A), x(B)) → pCircle(C, 0.35) → dCircle(C, 0.35) → eCircle(C, 0.35) → g
AI Drawing Prompt Reference
Draw a circle centered at the origin with radius 0.35. Mark a point on the circle and trace its vertical projection onto the x-axis as it rotates around the center. Plot the length of this projection against the angle to visualize the sine function. Also, draw the standard sine function graph on the same axes. Include a slider to control the angle and observe how the position of the projection and the sine value change.
The prompt above was compiled from the original drawing commands and is for reference only.