
Weighted Mean
Loading the math board and drawing, please wait…
In collections
Statistics and Probability with Mr Downes
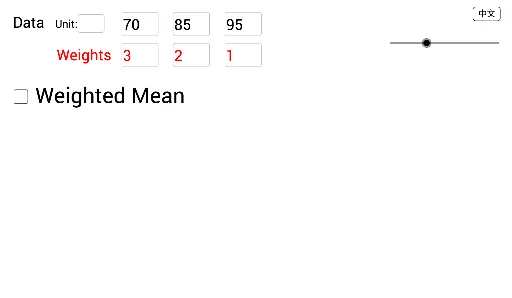
This GeoGebra example dynamically demonstrates the calculation of weighted means using interactive input boxes and data lists. It visualizes number distribution and weight relationships via bar charts, pie charts, and the unit circle. Core concepts include weighted averages, data visualization, and list-based computation. Construction utilizes GeoGebra commands such as Textfield, Sum, InputBox, and List, along with geometric objects like Line Segment and Circle Chart. Suitable for high school statistics, mathematical modeling, and data analysis courses.
GeoGebra Commands & Parameters
Textfield(d_1) → InputBox1Textfield(d_2) → InputBox2Textfield(d_3) → InputBox3Textfield(d_4) → InputBox4Textfield(d_5) → InputBox5Textfield(f_1) → InputBox1fTextfield(f_2) → InputBox2fTextfield(f_3) → InputBox3fTextfield(f_4) → InputBox4fTextfield(f_5) → InputBox5fSum(Take[listF, 1, n]) → FSum(Sequence[Text[Element[listD, i]] + "\textcolor{red}{×" + (Text[Element[listF, i] + "}+"]), i, 1, n]) → textDF_0Sum(Sequence["\textcolor{red}{" + (Text[Element[listF, i] + "}+"]), i, 1, n]) → textF_0Sum(Zip[(m * k), m, Take[listD, 1, n], k, Take[listF, 1, n]]) → DFTextfield(textUnit) → InputBoxUnit
AI Drawing Prompt Reference
This is a dynamic graphic demonstrating weighted mean calculations. The graphic includes interactive input boxes for entering data and weights, a data list to store these inputs, bar charts to show data distribution, pie charts to display weight relationships, and a unit circle for overall visualization. The construction order is to first create input boxes and the data list, then draw the bar charts, pie charts, and unit circle to illustrate the weighted mean calculation process and data relationships.
The prompt above was compiled from the original drawing commands and is for reference only.