
Estimating the Mean
Loading the math board and drawing, please wait…
In collections
Statistics and Probability with Mr Downes
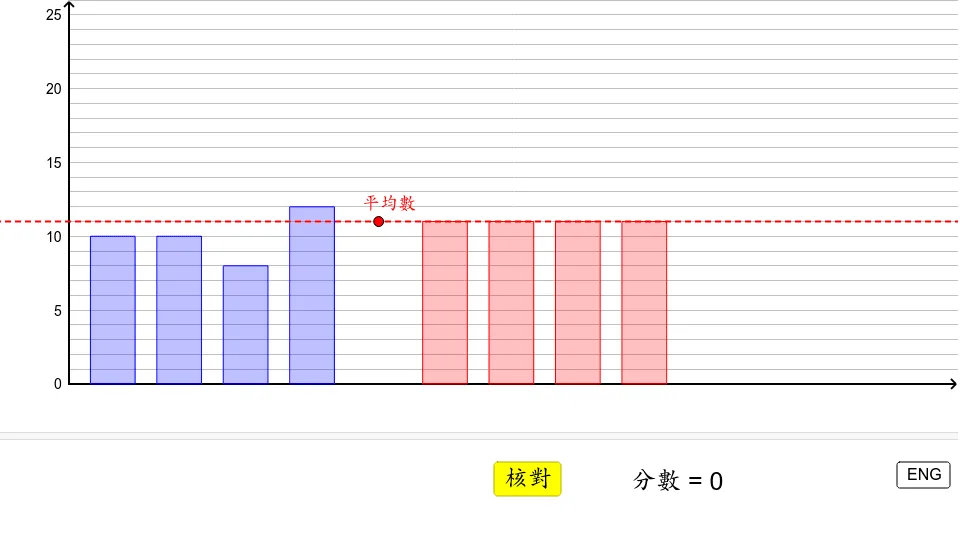
This GeoGebra example demonstrates the estimation of a population mean using random sampling, visualizing the distribution of sample means. Core mathematical concepts include point estimation, random sampling, sampling distribution of the mean, and the law of large numbers. Construction highlights: The applet employs commands such as Ray for drawing estimation lines, Random for generating random samples, If for conditional logic, Point for marking data points, and Sequence for creating data sequences. Key objects like maxN (maximum samples), f (function), n (sample size), a, b, c, d (parameters), mean (mean calculation) are used to build interactive bar charts and estimation lines. It is suitable for introductory statistics courses in high school or college, providing a hands-on visual learning experience.
GeoGebra Commands & Parameters
Ray((7, 0), (7, 1)) → fRandom(2, maxN) → nRandom(1, 20) → aRandom(1, 20) → bRandom(1, 20) → cRandom(1, 20) → dIf(n ≟ 2, {a, b'}, If[n ≟ 3, {a, b, c'}, {a, b, c, d'}]) → listNumPoint(f) → ASequence(Polygon[(8 + (1.5 * i), 0), (8 + (1.5 * i) + 1, 0), (8 + (1.5 * i) + 1, y(A)), (8 + (1.5 * i), y(A))], i, 0, n - 1) → listBarAvgSequence(Text[Element[listNum, i]] + "+", i, 1, n - 1) → listTextSequence(Polygon[(0.5 + (1.5 * i), 0), (0.5 + (1.5 * i) + 1, 0), (0.5 + (1.5 * i) + 1, Element[listNum, i + 1]), (0.5 + (1.5 * i), Element[listNum, i + 1])], i, 0, n - 1) → listBarSequence(Polygon[(0.5 + (1.5 * i), 0), (0.5 + (1.5 * i) + 1, 0), (0.5 + (1.5 * i) + 1, y(A)), (0.5 + (1.5 * i), y(A))], i, 0, n - 1) → listBarAvg2If(y(A) > mean, "high", If[y(A) < mean, "low", "correct"]) → estimateIf(correct, If[lang ≟ 1, "叻!", "Good!"], If[estimate ≟ "high", If[lang ≟ 1, "高估", "Overestimate"], If[estimate ≟ "low", If[lang ≟ 1, "低估", "Underestimate"]]]) → textFeedback
AI Drawing Prompt Reference
Create a visualization showing how to estimate the population mean using random sampling, including a vertical line for the estimate, bar charts for the distribution of sample means, and feedback text based on the comparison between sample means and the estimate. Start by drawing a vertical line, then randomly generate the sample size and function parameters. Generate sample points based on the sample size and represent each sample's mean with a bar chart. Also, show the distribution of sample means with another set of bar charts, and display different feedback text depending on whether the sample mean is higher, lower, or equal to the estimate.
The prompt above was compiled from the original drawing commands and is for reference only.