
UCSS Math I 4.1.2 Example 2: Comparing Two Data Sets Using Dot Plots
Loading the math board and drawing, please wait…
In collections
UCSS Secondary Math I Unit 4 Lesson 1
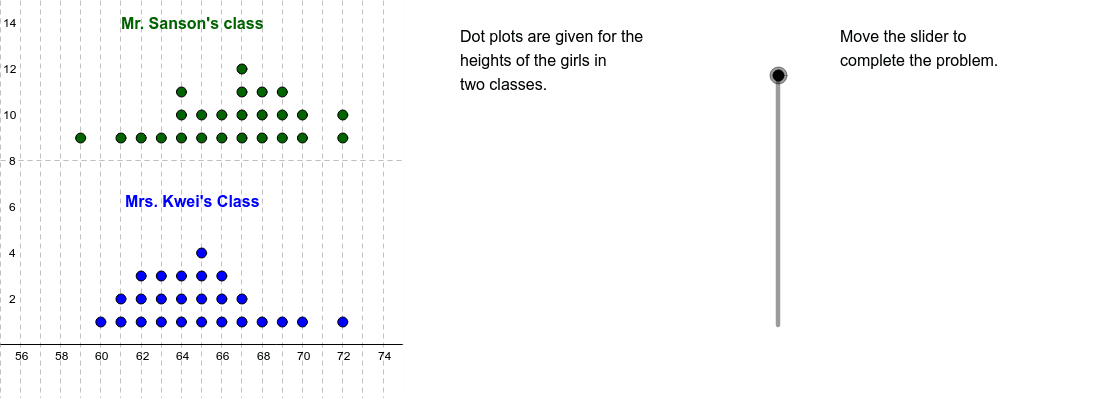
This example demonstrates how to use dot plots to visually compare the distributions of two data sets, serving as an introductory activity in statistics and data analysis. The core mathematical concepts include measures of central tendency (median), spread (minimum and maximum values), and comparative analysis of two groups. Construction highlights: The GeoGebra commands DotPlot, Median, Min, and Max are used to generate dot plots and compute key statistics for each data set. Additional commands such as Sequence, Join, Translate, Segment, and Polygon are employed to create auxiliary segments and shapes that emphasize the median positions and data ranges. Key objects include data lists SansonList and KweiList, their corresponding plot objects SansonPlot and KweiPlot, and labeled points A1–A14 and B1–B14 for annotation. This resource is suitable for high school or pre-university students learning statistical graphing and data comparison, and can also be used by teachers for classroom demonstrations.
GeoGebra Commands & Parameters
DotPlot(SansonList) → SansonPlotDotPlot(KweiList) → KweiPlotMedian(SansonList) → SMedMedian(KweiList) → KMedMin(SansonList) → SMinMax(SansonList) → SMaxMin(KweiList) → KMinMax(KweiList) → KMaxSequence(Sequence[Cell[1, i], j, 1, Cell[2, i]], i, 1, 14) → L1Join(L1) → L2Translate(SansonPlot, (0, 8)) → S2PlotSegment((KMin, 0), (KMin, 5)) → KMinSegSegment((KMax, 0), (KMax, 5)) → KMaxSegSegment((KMed, 0), (KMed, 5)) → KMedSegSegment((SMin, 8), (SMin, 13)) → SMinSegSegment((SMax, 8), (SMax, 13)) → SMaxSegSegment((SMed, 8), (SMed, 13)) → SMedSegPolygon((75, y(Corner[2])), Corner[2], Corner[3], (75, y(Corner[4]))) → Mask, a, b, c, d
AI Drawing Prompt Reference
Create two dot plots side by side, one for each data set, with the first plot above the second. Each dot plot shows individual data points as dots along a horizontal axis. For each plot, draw vertical line segments from the bottom to the top of the plot at the positions of the minimum, maximum, and median values. Add a semi-transparent rectangular region on the right side of the graph to mask out data beyond a certain threshold. The purpose is to visually compare the spread and central tendency of the two data sets.
The prompt above was compiled from the original drawing commands and is for reference only.