UCSS Secondary Math I Unit 4 Lesson 1
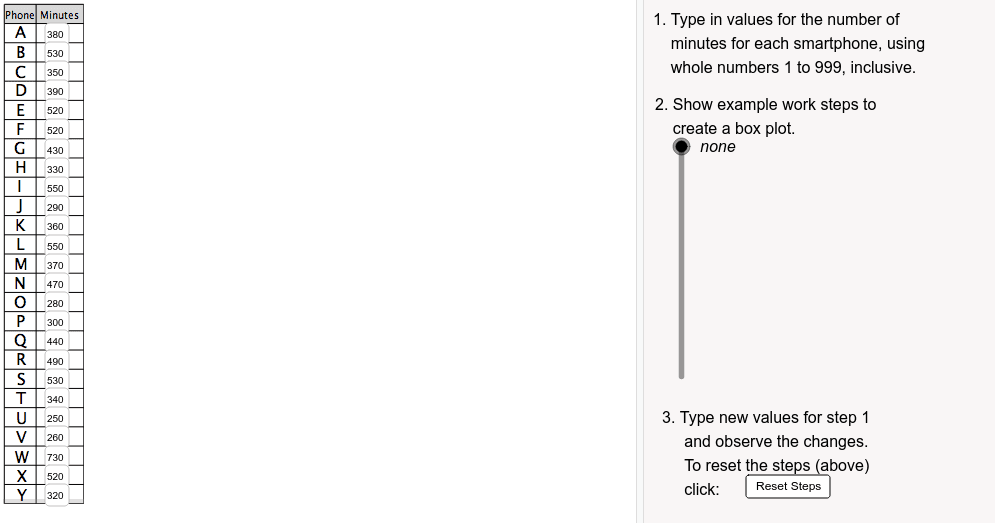
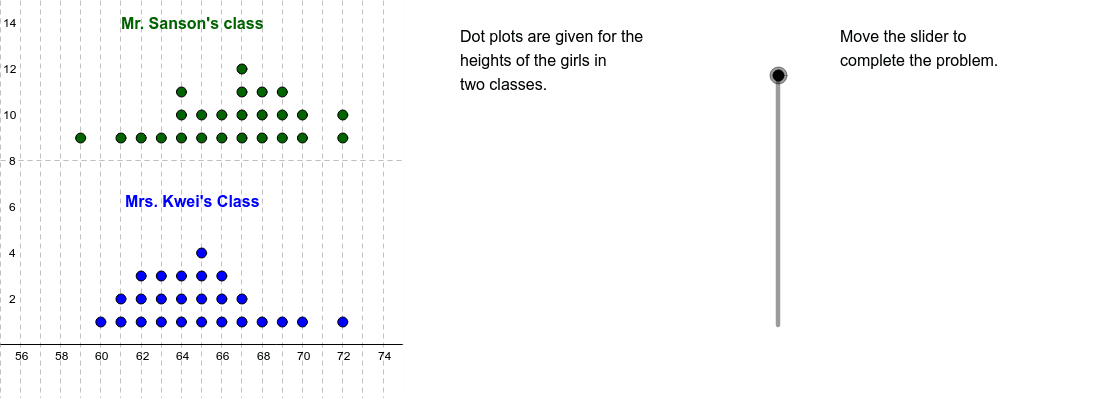
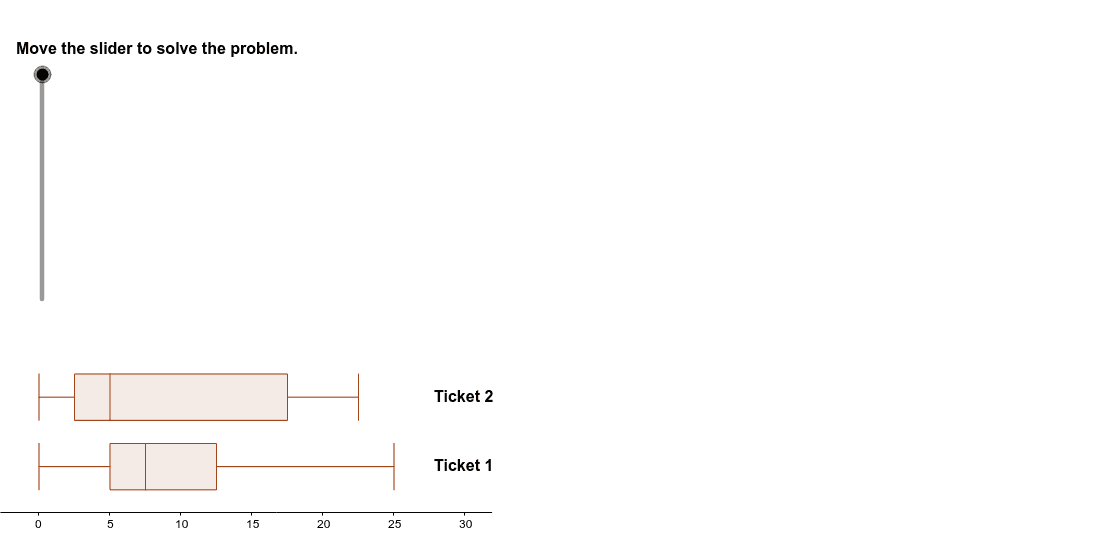
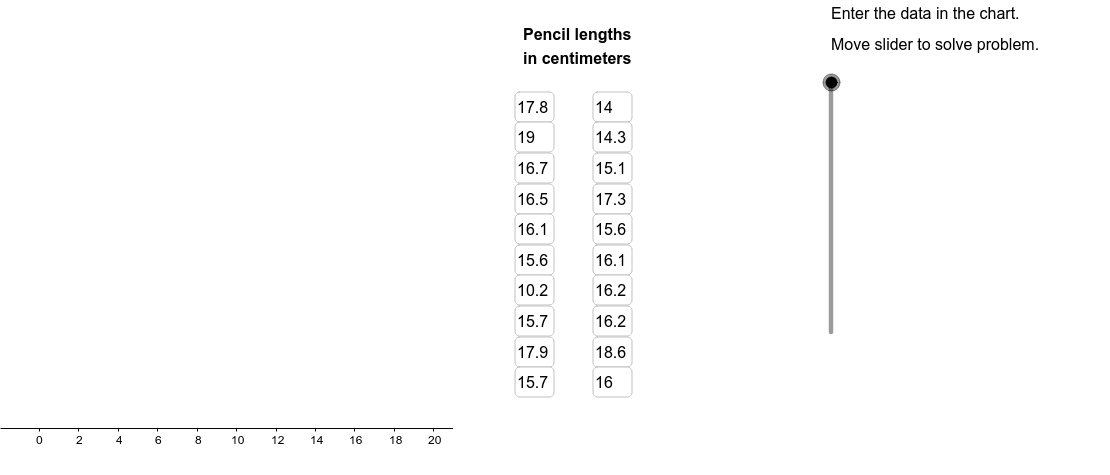
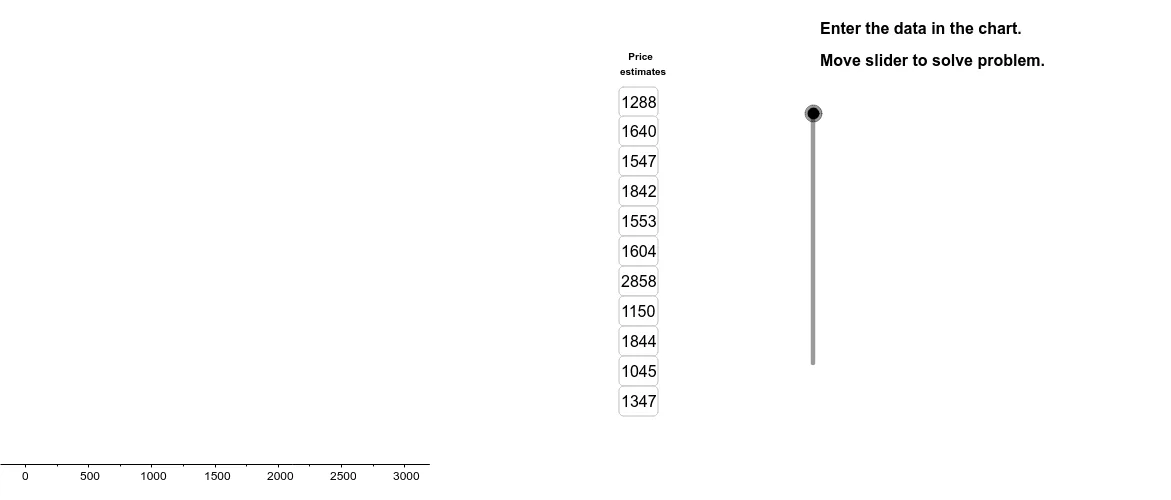
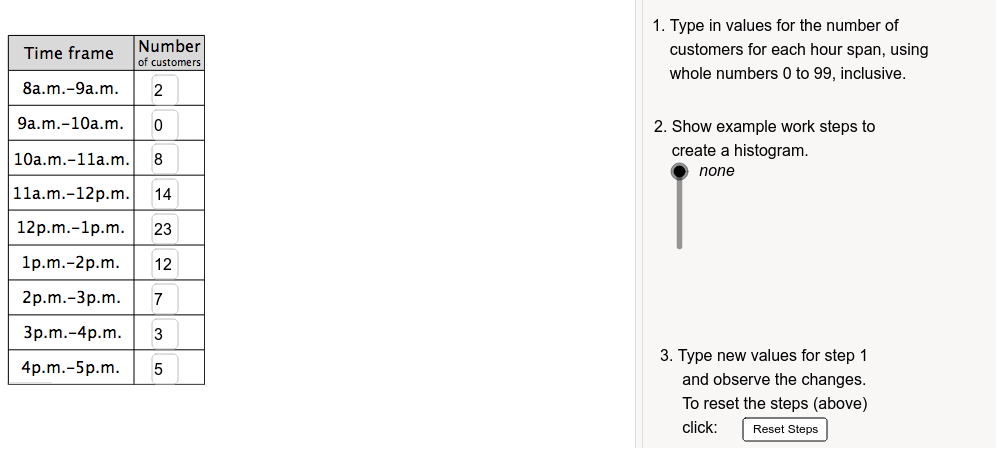
UCSS Secondary Math I Unit 4 Lesson 1 — Items 6 — Creating a Histogram with a Table、Draw a Box Plot to Represent Data、UCSS Math I 4.1.2 Example 2: Comparing Two Data Sets Using Dot Plots
UCSS Secondary Math I Unit 4 Lesson 1 — Items 6 — Creating a Histogram with a Table、Draw a Box Plot to Represent Data、UCSS Math I 4.1.2 Example 2: Comparing Two Data Sets Using Dot Plots