
House Painter Cost Estimation Analysis
Loading the math board and drawing, please wait…
In collections
UCSS Secondary Math I Unit 4 Lesson 1
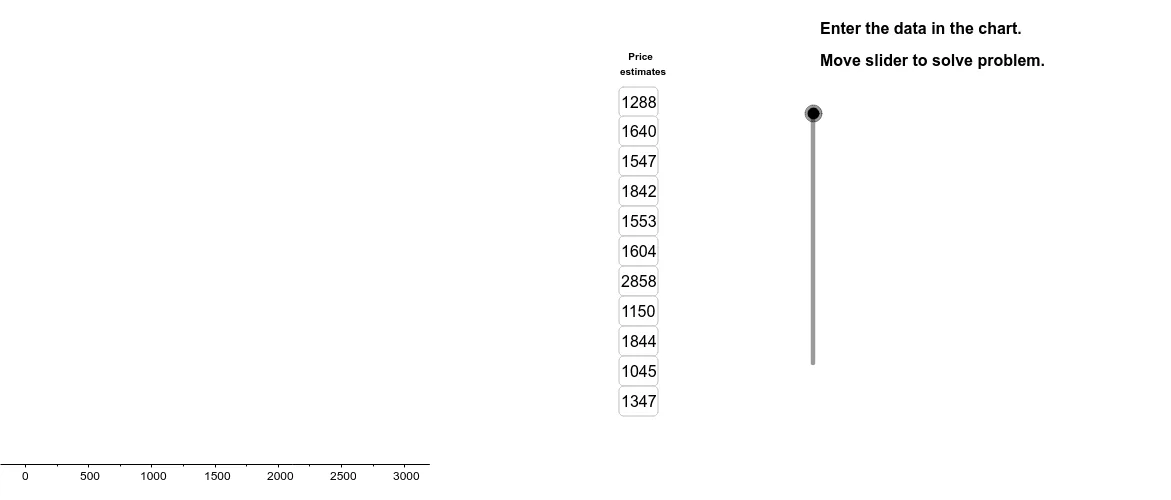
This example demonstrates how to use GeoGebra for statistical analysis of house painter cost estimates, including sorting, dot plots, and box plots. Core math concepts involve mean, median, quartiles, and probability & statistics. Construction highlights include commands like Sort, DotPlot, Median, Q1, Q3, BoxPlot, and objects such as ListMed, ListQ1, ListQ3. Suitable for high school students learning probability & statistics and data analysis.
GeoGebra Commands & Parameters
Sort(EstimateList) → SortedListDotPlot(SortedList) → DotPlotMedian(EstimateList) → ListMedQ1(EstimateList) → ListQ1Q3(EstimateList) → ListQ3BoxPlot(4, 1, EstimateList) → ListBoxSegment((ListMed, 0), (ListMed, 2.5)) → SegMedSegment((ListQ1, 0), (ListQ1, 2.5)) → SegQ1Segment((ListQ3, 0), (ListQ3, 2.5)) → SegQ3Segment((UpperLim, 0), (UpperLim, 2.5)) → SegUpperSegment((LowerLim, 0), (LowerLim, 2.5)) → SegLowerTextfield(A1) → InA1Textfield(A2) → InA2Textfield(A3) → InA3Textfield(A4) → InA4Textfield(A5) → InA5Textfield(A6) → InA6Textfield(A7) → InA7Textfield(A8) → InA8Textfield(A9) → InA9Textfield(A10) → InA10Textfield(A11) → InA11Element(SortedList, C1) → B1Element(SortedList, C2) → B2Element(SortedList, C3) → B3Element(SortedList, C4) → B4Element(SortedList, C5) → B5Element(SortedList, C6) → B6Element(SortedList, C7) → B7Element(SortedList, C8) → B8Element(SortedList, C9) → B9Element(SortedList, C10) → B10Element(SortedList, C11) → B11RemoveUndefined(Sequence[If[Element[SortedList, i] < LowerLim, Element[SortedList, i]], i, 1, 20]) → LowOutRemoveUndefined(Sequence[If[Element[SortedList, i] > UpperLim, Element[SortedList, i]], i, 1, 20]) → HighOutJoin({LowOut, HighOut}) → OutliersPolygon((3200, y(Corner[1])), Corner[2], Corner[3], (3200, y(Corner[4]))) → Mask, a, b, g, hMean(SortedList) → ListMeanLength(EstimateList) → ListLengthRemoveUndefined(Sequence[If[(Element[SortedList, i] > LowerLim) ∧ (Element[SortedList, i] < UpperLim), Element[SortedList, i]], i, 1, ListLength]) → GoodListLength(GoodList) → GoodLengthMean(GoodList) → GoodMeanElement(SortedList, 1) → ListLowElement(SortedList, ListLength) → ListHighElement(GoodList, 1) → GoodLowElement(GoodList, GoodLength) → GoodHighPolygon(A, B, C, D) → poly1, a_1, b_1, c, dPolygon(E, F, G, H) → poly2, e, f, g_1, h_1Polygon(I, J, K, L) → poly3, i, j, k, l
AI Drawing Prompt Reference
Create a statistical analysis chart for house painter cost estimates. Start by plotting a dot chart for all estimate values, then add horizontal line segments for the median, first quartile, and third quartile. Next, draw a box plot with the box covering the quartile range and a line inside for the median. Mark outliers as points outside the box. Finally, label key statistics like mean, max, and min values below the chart.
The prompt above was compiled from the original drawing commands and is for reference only.