
Describing the Distribution (with Box plots)
Loading the math board and drawing, please wait…
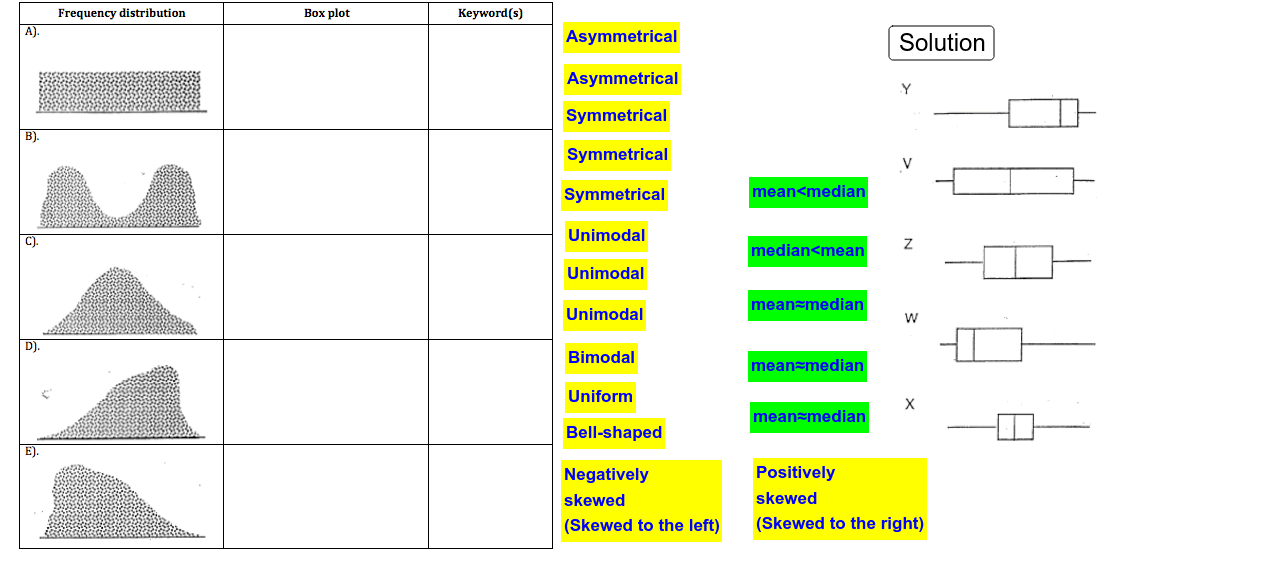
① This example demonstrates how to describe the distribution of a dataset using box plots, visually showing the median, quartiles, range, and potential outliers. ② Core mathematical concepts include descriptive statistics: the five-number summary (minimum, first quartile, median, third quartile, maximum), construction and interpretation of box plots, and recognizing distribution shapes (symmetric vs. skewed). ③ Construction highlights: from the construction summary, the GeoGebra file uses numerous text objects (text1 through text1_17) for labels and explanations, several inserted images (pic1 to pic6) for visual aids, and defines multiple points (A through P) likely representing data values or graphical elements. It integrates algebra and linear equations contexts, possibly using GeoGebra's statistical tools or manual construction of box plot components. ④ This is suitable for middle school (upper grades) through high school statistics and probability lessons, as well as introductory college statistics courses, helping learners connect abstract statistical measures to intuitive graphical representations.
GeoGebra Commands & Parameters
Point A(0.28, 4.4)Point B(0.3, 2.24)Point C(0.32, 0.1)Point D(0.28, -2.06)Point E(0.32, -4.2)Point F(4.48, 5.32)Point G(4.46, 3.2)Point H(4.46, 1.2)Point I(4.44, -0.96)Point J(4.4, -3.14)Point K(4.44, 4.44)Point L(4.46, 2.4)Point M(4.44, 0.32)Point N(7.24, 0.32)Point O(4.46, -1.82)Point P(4.46, -4.18)Point Q(7.1, 5.14)Point R(7.08, 3.18)Point S(7.22, 1.06)Point T(10.98, -1.12)Point U(10.98, -3.22)Point V(7.18, -1)Point W(7.06, -3.08)
AI Drawing Prompt Reference
Draw a box plot to show the distribution of data. Include points representing the minimum, first quartile, median, third quartile, and maximum, along with potential outliers. The box plot should clearly show the range and shape of the distribution to help understand statistical features.
The prompt above was compiled from the original drawing commands and is for reference only.