
Average Price Simulation
Loading the math board and drawing, please wait…
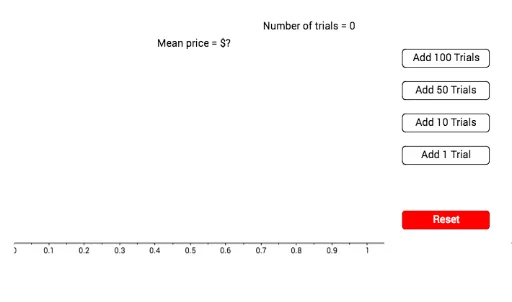
This example demonstrates statistical distributions and curve sketching through simulated price data. Core math concepts include statistics, polygon construction, function graphing, transformations, and probability & statistics. Construction highlights include commands like Random, DotPlot, Polygon, Point, and BoxPlot from GeoGebra. Suitable for high school and above, ideal for teaching probability statistics and coordinate geometry.
GeoGebra Commands & Parameters
Random(1, 6) → d1Random(1, 6) → d2DotPlot(prices, false, 0.2) → list1Polygon(A, B, C, D) → poly1, a, b, c, dPoint(f) → EBoxPlot(5, 0.25, prices) → eBoxPlot(5, 0.25, prices) → g
AI Drawing Prompt Reference
Visualize statistical distributions and curve sketching with simulated price data, including randomly generated dot plots, polygon construction, function graphs, transformations, and probability statistics, suitable for high school education, with box plots and dot plots to illustrate data distribution.
The prompt above was compiled from the original drawing commands and is for reference only.