
Histogram Construction and Statistical Demonstration
Loading the math board and drawing, please wait…
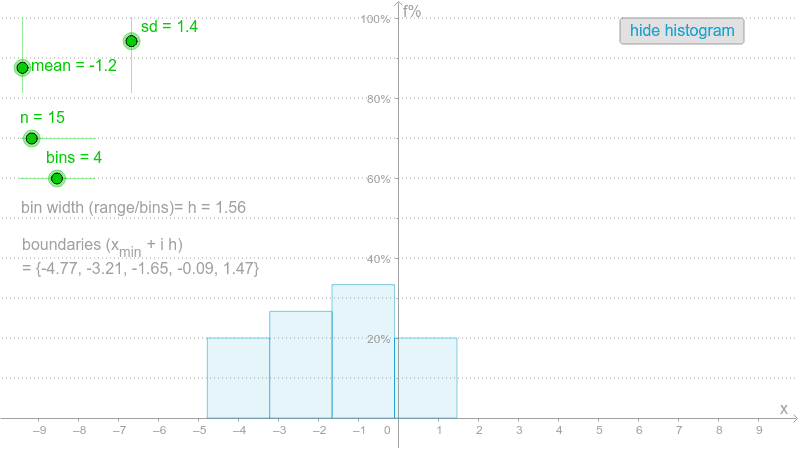
This example demonstrates how to construct a histogram using GeoGebra to visualize data distribution. Key math concepts include data distribution, frequency statistics, normal distribution, and statistical graphing. It utilizes commands and objects like Sequence, Max, Min, Frequency, and Histogram. Suitable for high school and above students learning statistical graphing and data analysis.
GeoGebra Commands & Parameters
Sequence(RandomNormal[mean, sd], i, 1, n) → valuesMax(values) → maxMin(values) → minSequence(min + i * h, i, 0, bins) → boundariesFrequency(boundaries, values) → list1Histogram(boundaries, K) → bSequence(Segment[(-10, i), (10, i)], i, 10, 100, 10) → list2
AI Drawing Prompt Reference
Create a histogram to visualize the frequency distribution of a set of normally distributed random data. First, generate a set of normally distributed random data, find the maximum and minimum values of the data, then create the boundaries for the histogram, calculate the frequency for each interval, and finally draw the histogram. Also, draw a series of horizontal line segments from -10 to 10, spaced 10 units apart, as auxiliary lines.
The prompt above was compiled from the original drawing commands and is for reference only.