
Dice Rolling Simulation by sonom
Loading the math board and drawing, please wait…
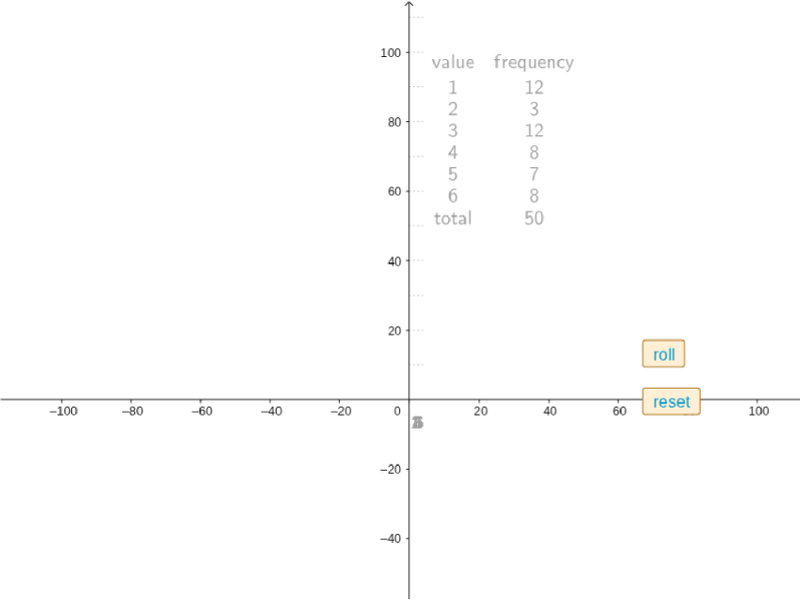
This example simulates the process of rolling a dice. It involves core concepts of probability and statistics. Commands used include CountIf, If, TableText, Unique, Append, Frequency, BarChart, and Sequence. Suitable for teaching probability and statistics.
GeoGebra Commands & Parameters
CountIf(x ≠ 0, trials) → nIf(n > 0, n, 1) → n1TableText({trials}) → text3Unique(trials) → list2Append("value", list2) → list3Frequency(trials) → list4Append("frequency", list4) → list5Append(list5, n) → list6Append(list3, "total") → list7TableText({list7, list6}, "cv") → text1BarChart(0.3, 0.5, {100 * CountIf[x ≟ 1, trials] / n1}) → cBarChart(0.5, 0.7, {100 * CountIf[x ≟ 2, trials] / n1}) → dBarChart(0.7, 0.9, {100 * CountIf[x ≟ 3, trials] / n1}) → bBarChart(0.9, 1.1, {100 * CountIf[x ≟ 4, trials] / n1}) → eBarChart(1.1, 1.3, {100 * CountIf[x ≟ 5, trials] / n1}) → fBarChart(1.3, 1.5, {100 * CountIf[x ≟ 6, trials] / n1}) → gSequence(Segment[(0, i), (4, i)], i, 10, 120, 10) → list1
AI Drawing Prompt Reference
Create a dice rolling simulation with a slider to control the number of rolls, a bar chart to show the frequency of each number, and a text box to display statistical information about the rolls. Start by setting up the slider, then generate random roll results, count the occurrences of each number, and finally draw the bar chart and text box.
The prompt above was compiled from the original drawing commands and is for reference only.