
Rolling Two Dice by sonom
Loading the math board and drawing, please wait…
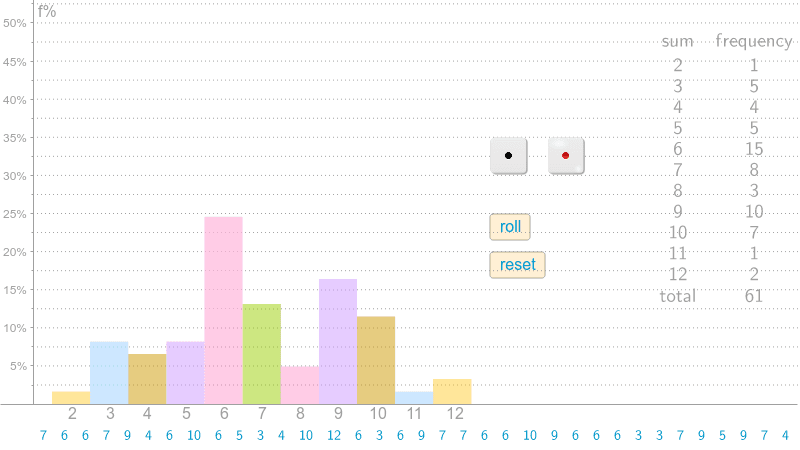
This example demonstrates the statistical distribution of results when rolling two dice, involving core concepts like probability & statistics, frequency distribution, and bar charts. It is constructed using GeoGebra commands and objects such as CountIf, If, TableText, Unique, Append, Frequency, BarChart, and Sequence, making it suitable for high school students learning probability and data analysis.
GeoGebra Commands & Parameters
CountIf(x ≠ 0, trials) → nIf(n > 0, n, 1) → n1TableText({trials}) → text3Unique(trials) → list2Append("sum", list2) → list3Frequency(trials) → list4Append("frequency", list4) → list5Append(list5, n) → list6Append(list3, "total") → list7TableText({list7, list6}, "cv") → text1BarChart(0.05, 0.15, {100 * CountIf[x ≟ 2, trials] / n1}) → cBarChart(0.15, 0.25, {100 * CountIf[x ≟ 3, trials] / n1}) → dBarChart(0.25, 0.35, {100 * CountIf[x ≟ 4, trials] / n1}) → eBarChart(0.35, 0.45, {100 * CountIf[x ≟ 5, trials] / n1}) → fBarChart(0.45, 0.55, {100 * CountIf[x ≟ 6, trials] / n1}) → gBarChart(0.55, 0.65, {100 * CountIf[x ≟ 7, trials] / n1}) → hBarChart(0.65, 0.75, {100 * CountIf[x ≟ 8, trials] / n1}) → iBarChart(0.75, 0.85, {100 * CountIf[x ≟ 9, trials] / n1}) → jBarChart(0.85, 0.95, {100 * CountIf[x ≟ 10, trials] / n1}) → kBarChart(0.95, 1.05, {100 * CountIf[x ≟ 11, trials] / n1}) → lBarChart(1.05, 1.15, {100 * CountIf[x ≟ 12, trials] / n1}) → mSequence(Segment[(0, i), (4, i)], i, 2.5, 100, 2.5) → list1
AI Drawing Prompt Reference
Create a statistical graph to show the distribution of results when rolling two dice. Generate a table of multiple dice rolls, count the frequency of each outcome, and calculate the total number of rolls. Then, draw a series of bar charts where each bar represents a dice sum, with the height indicating the percentage frequency of that sum. Finally, add a text box below the charts listing all sums and their corresponding frequencies.
The prompt above was compiled from the original drawing commands and is for reference only.