
Sequences As Functions, Example 3
Loading the math board and drawing, please wait…
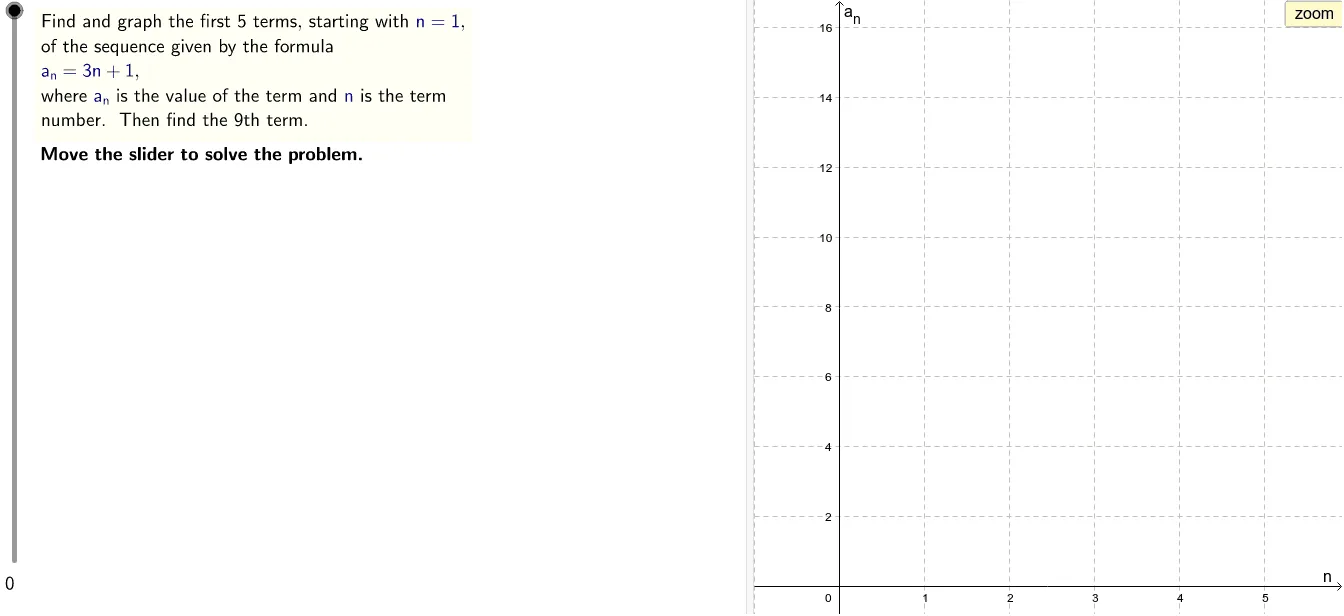
This example demonstrates how to find the ninth term in a sequence defined by the formula a_n = 3n + 1. It covers the relationship between sequences and functions. Key GeoGebra commands and objects used include LaTeX, Corner, If, Sequence, TableText, Max, Min, stepMax, stepper, steps, counter, text0, RandomizationText, Original, Randomize, button1, topright, bottomleft, heightToWidth, button2, xscale, yscale, coef, const, and objects B1 to B10. Suitable for middle school and above, focusing on sequence-function conversion and computation.
GeoGebra Commands & Parameters
LaTeX(steps) → counterLaTeX("\text{Move the slider to solve the problem.}") → text0LaTeX("\text{Use the buttons below to return to the original}\cr\text{problem or randomly generate a similar practice}\cr\text{problem.}") → RandomizationTextCorner(2, 3) → toprightCorner(2, 1) → bottomleftIf(const > 0, "+", "-") → constSignIf(choose ≟ 0, LaTeX[(((("a_n=" * coef) * "n") * constSign) * absConst)], LaTeX[(((((("a_n=" * coef) * "a_{n-1}") * constSign) * absConst) * "\text{ and }a_0=") * const)]) → formulaIf(choose ≟ 0, explicit, recursive) → sequenceValsSequence((n(j), sequenceVals(j)), j, 1, graphterms) → plotPointsLaTeX("\text{Determine whether this is an explicit formula or a}\cr\text{recursive formula.}") → text1LaTeX((((((("\text{Find and graph the first " * graphterms) * " terms, starting with }\textcolor{#000099}{n=1}\text{,}\cr\text{of the sequence given by the formula }\cr\textcolor{#000099}{") * formula) * "}\text{,}\cr\text{where }\textcolor{#000099}{a_n}\text{ is the value of the term and }\textcolor{#000099}{n}\text{ is the term}\cr\text{number. Then find the ") * finalterm) * "th term.}")) → ProblemIf(choose ≟ 0, LaTeX["\text{This is an explicit formula because the right hand}\cr\text{side depends only on }\textcolor{#000099}{n}\text{ and not on }\textcolor{#000099}{a_{n-1}}\text{ or similar}\cr\text{terms.}"], LaTeX["\text{This is a recursive formula because the right hand}\cr\text{side depends on }\textcolor{#000099}{a_{n-1}}\text{ and we are given an initial}\cr\text{term, }\textcolor{#000099}{a_0}\text{.}"]) → text2LaTeX((("\text{Find the first " * graphterms) * " terms of the sequence.}")) → text3If(choose ≟ 0, Sequence[LaTeX[(((((((((("a_" * k) * "=") * coef) * "(") * k) * ")") * constSign) * absConst) * "=") * sequenceVals(k))], k, 1, graphterms], Append[LaTeX[(((((((("a_1=" * coef) * "(") * const) * ")") * constSign) * absConst) * "=") * sequenceVals(1))], Sequence[LaTeX[(((((((((("a_" * k) * "=") * coef) * "(") * sequenceVals(k - 1)) * ")") * constSign) * absConst) * "=") * sequenceVals(k))], k, 2, graphterms]]) → firstTermsLaTeX((("\text{Substitute the respective values for }\textcolor{#000099}{n=1}\text{ through }\cr\textcolor{#000099}{n=" * graphterms) * "}\text{.}")) → text4LaTeX(formula) → text4bTableText({firstTerms}, "v") → text4cSequence(sequenceVals(k), k, 1, graphterms - 1) → shortListLaTeX("\text{Create ordered pairs from the sequence.}") → text5LaTeX("\text{The first coordinate is }\textcolor{#000099}{n}\text{ and the second coordinate}\cr\text{is }\textcolor{#000099}{a_n}\text{.}") → text6LaTeX("\text{Plot the ordered pairs.}") → text8LaTeX((("\text{Find the " * finalterm) * "th term in the sequence.}")) → text9If(choose ≟ 0, LaTeX[(((("\text{Since the sequence is explicitly defined, evaluate}\cr\text{the formula, }\textcolor{#000099}{" * formula) * "}\text{ at }\textcolor{#000099}{n=") * finalterm) * "}\text{.}")], LaTeX[(("\text{Since the sequence is recursively defined, continue}\cr\text{building up to the " * finalterm) * "th term one term at a time.}")]) → text10aSequence(sequenceVals(k), k, 1, graphterms) → graphedListMax(0, Max[graphedList]) → maxySequence(LaTeX[(((((((((("a_" * k) * "=") * coef) * "(") * sequenceVals(k - 1)) * ")") * constSign) * absConst) * "=") * sequenceVals(k))], k, graphterms + 1, finalterm) → moreTermsIf(choose ≟ 0, LaTeX[(((((((((("a_" * finalterm) * "=") * coef) * "(") * finalterm) * ")") * constSign) * const) * "=") * sequenceVals(finalterm))], TableText[{moreTerms}, "v"]) → text10bLaTeX((((("\text{The " * finalterm) * "th term in the sequence is ") * sequenceVals(finalterm)) * ".}")) → text10cLaTeX((((((("\text{" * text10a) * "}\cr\textcolor{#000099}{") * text10b) * "}\cr\text{") * text10c) * "}")) → text10LaTeX((((((("\text{The first " * graphterms) * " values are ") * shortList) * "}\cr\text{and ") * sequenceVals(graphterms)) * ".}")) → text4dTableText({Append[LaTeX["(n,a_n)"], plotPoints]}, "v") → text7Min(0, Min[graphedList]) → miny
AI Drawing Prompt Reference
Create a graph showing the function a_n = 3n + 1 and its sequence points. Include a slider to calculate and display the first few terms of the sequence, highlighting the 9th term. Plot the sequence points and compare them with the function graph. Label key information like sequence values, the function formula, and the 9th term result, noting that it's an explicit formula.
The prompt above was compiled from the original drawing commands and is for reference only.