
Investigating the Properties of an Isosceles Trapezoid
Loading the math board and drawing, please wait…
This example demonstrates the properties of an isosceles trapezoid. Key mathematical concepts include linear equations, properties of isosceles trapezoids, and logical reasoning. Using GeoGebra commands such as Corner, Simplify, and If, the construction process of the isosceles trapezoid is dynamically displayed. Suitable for middle school and above students to learn geometric construction and logical reasoning.
GeoGebra Commands & Parameters
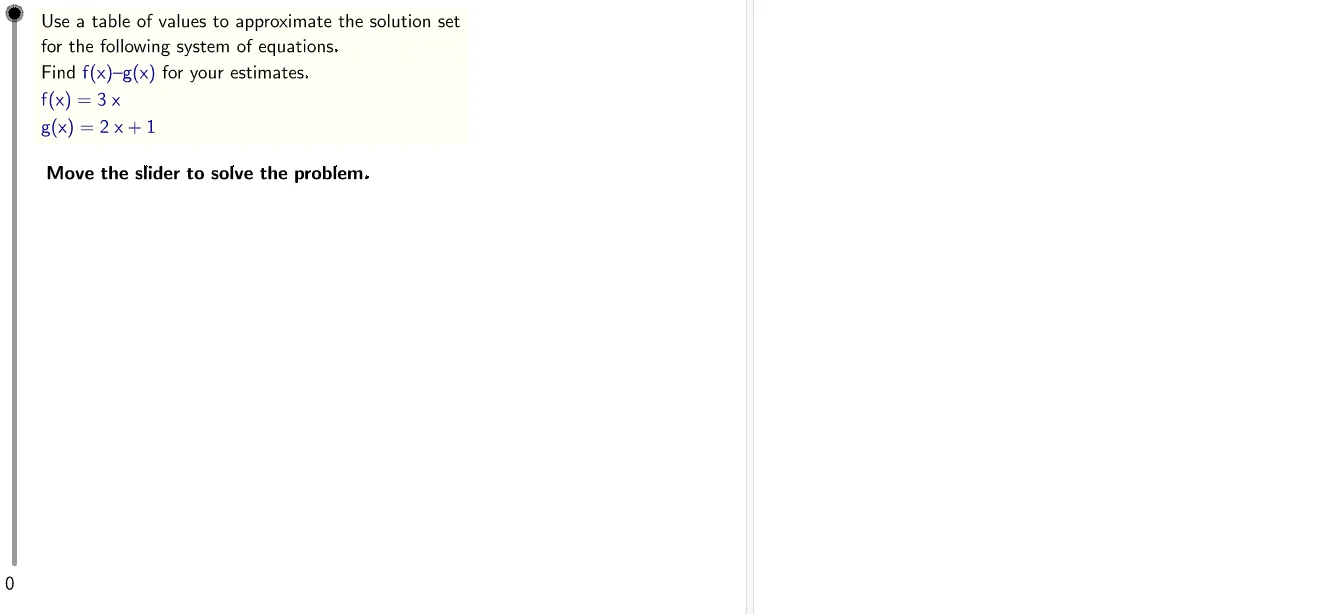
LaTeX(steps) → counterLaTeX("\text{Move the slider to solve the problem.}") → text0LaTeX("\text{Use the buttons below to return to the original}\cr\text{problem or randomly generate a similar practice}\cr\text{problem.}") → RandomizationTextCorner(2, 3) → toprightCorner(2, 1) → bottomleftSimplify((ga * x) + gb) → gIf(gb > 0, LaTeX[("+" * gb)], LaTeX[gb]) → gaddIf(ydiff ≟ 0, LaTeX["satisfies"], LaTeX["approximately satisfies"]) → satIf(ydiff ≟ 0, LaTeX["x-coordinate"], LaTeX["approximate x-coordinate"]) → coordIf(ydiff ≟ 0, LaTeX["solution"], LaTeX["approximate solution"]) → solnLaTeX((((("\text{Use a table of values to approximate the solution set}\cr\text{for the following system of equations.}\cr\text{Find }\textcolor{#000099}{f(x) – g(x)}\text{ for your estimates.}\cr\textcolor{#000099}{f(x)=" * f) * "}\cr\textcolor{#000099}{g(x)=") * g) * "}")) → ProblemLaTeX((((("\text{Create a table of values for }\textcolor{#000099}{f(x) = " * f) * "}\text{ and }\cr\textcolor{#000099}{g(x) = ") * g) * "}\text{.}")) → text1Sequence(i, i, (-xscale), xscale) → xvaluesZip(f(j), j, xvalues) → fvaluesZip(g(j), j, xvalues) → gvaluesZip(j - k, j, fvalues, k, gvalues) → fgdiffsTableText({Append[LaTeX["\textcolor{#000099}{x}"], xvalues], Append[LaTeX["\textcolor{#000099}{f(x)}"], fvalues], Append[LaTeX["\textcolor{#000099}{g(x)}"], gvalues], Append[LaTeX["\textcolor{#000099}{f(x)-g(x)}"], fgdiffs]}, "vr") → text2LaTeX("\text{In column }\textcolor{#000099}{f(x) – g(x)}\text{, look for sign changes.}") → text3Sequence(If[sgn(fgdiffs(k)) ≟ sgn(fgdiffs(k + 1)), "F", "T"], k, 1, Length[fgdiffs] - 2) → signChangeLength(signChange \ {"F"}) → numrowsIndexOf("T", signChange) → firstchangeLaTeX((((("\text{There is a sign change from }\textcolor{#000099}{x=" * xvalues(firstchange)) * "}\text{ to }\textcolor{#000099}{x=") * xvalues(firstchange + numrows)) * "}\text{.}")) → text4Sequence(fgdiffs(k), k, firstchange, firstchange + numrows) → fgdiffsSSequence(fvalues(k), k, firstchange, firstchange + numrows) → fvaluesSSequence(gvalues(k), k, firstchange, firstchange + numrows) → gvaluesSSequence(xvalues(k), k, firstchange, firstchange + numrows) → xvaluesSTableText({Append[LaTeX["\textcolor{#000099}{x}"], xvaluesS], Append[LaTeX["\textcolor{#000099}{f(x)}"], fvaluesS], Append[LaTeX["\textcolor{#000099}{g(x)}"], gvaluesS], Append[LaTeX["\textcolor{#000099}{f(x)-g(x)}"], fgdiffsS]}, "vr") → text4bIf(solx ≟ floor(solx), "int", "rat") → versionLaTeX(LaTeX["\text{The sign change occurs between adjacent integers}\cr\text{so look at values in between them.}"]) → text5BSequence(k, k, xvalues(firstchange), xvalues(firstchange) + 1, 0.1) → xvalues2Zip(f(k), k, xvalues2) → fvalues2Zip(g(k), k, xvalues2) → gvalues2Zip(j - k, j, fvalues2, k, gvalues2) → fgdiffs2Sequence(If[sgn(fgdiffs2(k)) ≟ sgn(fgdiffs2(k + 1)), "F", "T"], k, 1, Length[fgdiffs2] - 2) → signChange2LaTeX((((((("\text{Between these points, at }\textcolor{#000099}{x=" * solx) * "}\text{,}\cr\textcolor{#000099}{f(x)-g(x)=") * yapproxf) * "- (") * yapproxg) * ")= 0}\text{.}")) → text5LaTeX((((((((("\text{This tells us the curves }\textcolor{#000099}{f}\text{ and }\textcolor{#000099}{g}\text{ intersect at }\cr\textcolor{#000099}{x = " * xapprox) * "}\text{. The corresponding y-value is}\cr\text{}\textcolor{#000099}{") * yapproxf) * "}\text{. }\text{Therefore, the solution set of this}\cr\text{system is }\textcolor{#000099}{(") * xapprox) * ", ") * yapproxf) * ")}\text{.}")) → text6TableText({Append[LaTeX["\textcolor{#000099}{x}"], xvalues2], Append[LaTeX["\textcolor{#000099}{f(x)}"], fvalues2], Append[LaTeX["\textcolor{#000099}{g(x)}"], gvalues2], Append[LaTeX["\textcolor{#000099}{f(x)-g(x)}"], fgdiffs2]}, "vr") → text5CLaTeX((((((((("\text{This tells us the curves }\textcolor{#000099}{f}\text{ and }\textcolor{#000099}{g}\text{ intersect at }\cr\text{approximately }\textcolor{#000099}{x \approx " * solx) * "}\text{. The corresponding y-value}\cr\text{is approximately }\textcolor{#000099}{") * soly) * "}\text{. }\text{Therefore, the approximate}\cr\text{solution set of this system is }\textcolor{#000099}{(") * solx) * ", ") * soly) * ")}\text{.}")) → text6BLength(signChange2 \ {"F"}) → Sign2CountLaTeX("\text{Since zero once again doesn't show up in the }\cr\textcolor{#000099}{f(x)-g(x)}\text{ values, the actual intersection falls}\cr\text{between table values. The solution above rounds}\cr\text{to the nearest tenth.}") → text6C