
Interactive Geometry Demo on Symmetry and Hypothesis Testing
Loading the math board and drawing, please wait…
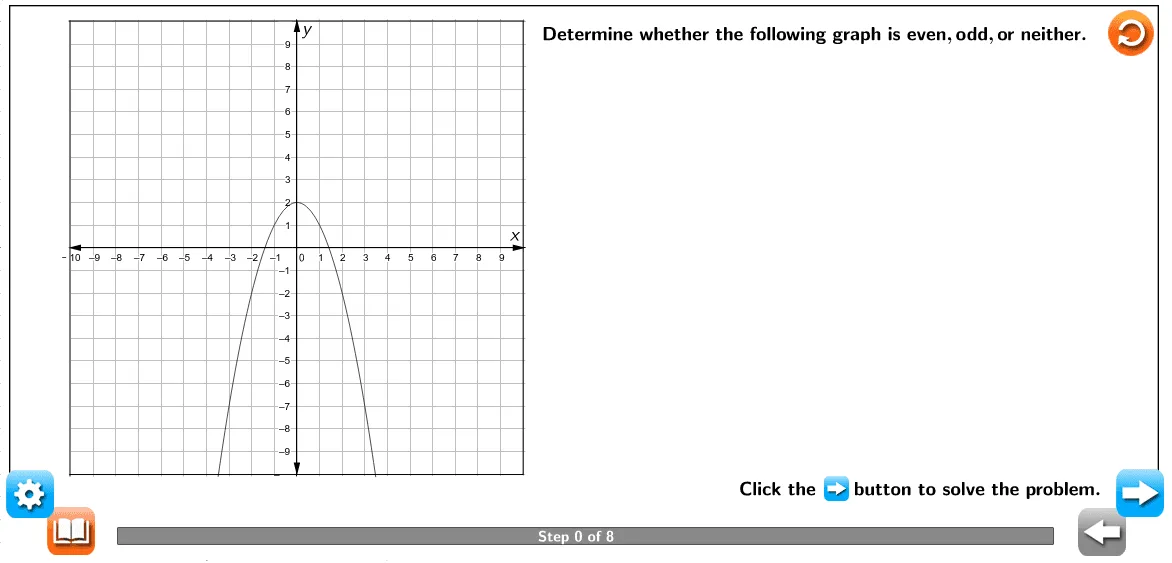
This GeoGebra example is a comprehensive interactive demonstration that integrates symmetry, hypothesis testing, arithmetic operations, algebra, tangent function, and pie/circle charts. It constructs a dynamic environment using basic geometric objects such as polygons, points, segments, intersections, and vectors, along with interactive controls like sliders, buttons, and text labels. The construction employs LaTeX for mathematical notation and commands like Polygon, Point, Segment, Intersect, and Vector to build the core figures)Skip. Suitable for middle school to university students, it helps visualize symmetric properties, statistical testing representations, and connections between functions and geometry. It also serves as a valuable resource for educators designing interactive math lessons.
GeoGebra Commands & Parameters
LaTeX("\text{\mathit{x}}") → text9_1LaTeX("\text{\mathit{y}}") → text9_2Polygon(A, B, C, D, E, F) → poly1, a_1, b_1, c_1, d, e, fPoint(d) → GPolygon(G, H, I, D) → poly2, g, h, i, d_1Point(e) → JPoint(g) → KPolygon(F, J, K, H) → poly3, f_1, j, k, h_1Segment(L, M) → lSegment(M, N) → mSegment(N, O) → nSegment(O, L) → pPolygon(R, S, T, U) → poly4, r, s, t, uIntersect(xAxis, yAxis) → VPoint(xAxis) → WVector(V, W) → vPoint(yAxis) → ZVector(V, Z) → wPoint(yAxis) → A_1Vector(V, A_1) → qPoint(xAxis) → B_1Vector(V, B_1) → u_1Point(yAxis) → N_1Polygon(M_1, N_1, O_1) → poly6, o_1, m_2, n_1Polygon(P_1, Q_1, R_1) → poly7, r_1, p_1, q_1Polygon(S_1, T_1, U_1) → poly8, u_2, s_1, t_1Segment(V_1, W_1) → e_1Segment(Z_1, A_2) → f_2Segment(B_2, C_2) → g_2Segment(D_2, E_2) → h_2Segment(F_2, E_2) → n_2LaTeX("\text{Click the button to solve the problem.}") → text3LaTeX("\text{\mathbf{Note}\mathbf{:} Use the (Data Kit) \\to return to the original \\problem or randomly generate \\a similar practice problem.\\Use the (Definition) to \\review words to know.}") → text4LaTeX("\text{Recall what we know.}") → text2LaTeX("\text{Check for symmetry across the origin.}") → text6LaTeX("\text{Check for symmetry across the \textcolor{#000099}{\mathit{y}}-axis.}") → text2_7LaTeX("\text{The function is even.}") → text2_9LaTeX("\text{We can see that this graph is symmetric across the \textcolor{#000099}{\mathit{y}}-axis.\\We can also see that the function is an upside-down parabola that is\\shifted up \textcolor{#000099}{2} units.To verify that this function is even,find the equation\\of the graph,\textcolor{#000099}{\mathit{f(x)} = –\mathit{x}^2 + 2},and see if it is equal to \textcolor{#000099}{\mathit{f(–x)}}.}") → text2_5LaTeX("\text{We can see that this graph is not symmetric across the origin.}") → text2_3LaTeX((("\text{Function:\textcolor{#000099}{\mathit{f(x)} = -\mathit{x}^2+{" * a) * "}}}")) → text2_2Polygon(C_1, D_1, E_1, F_1) → q1, c_2, d_2, e_2, f_3LaTeX("\text{\mathbf{Function:}\;A relation or expression involving one or more variables.}") → text2_{16}LaTeX("\text{\mathbf{Symmetric:}\;Made up of exactly similar parts facing each other or around an axis.}") → text2_{13}LaTeX("\text{Determine whether the following graph is even,odd,or neither.}") → text1_1LaTeX("\text{An odd function is symmetric across the origin,and an even function\\is symmetric across the \textcolor{#000099}{\mathit{y}}-axis.}") → text2_1Polygon(G_1, H_1, G_2) → t1, g_1, g_3, h_3LaTeX("\text{0}") → text5LaTeX("\text{-}") → text7LaTeX((("\text{\textcolor{#000099}{\mathit{f(–x)} = –(–\mathit{x})^2 + 2 = –\mathit{x}^2 + {" * a) * "}}}")) → text2_8LaTeX((("\text{Step {" * Slider) * "} of 8}")) → text2_{10}LaTeX("\text{However,we can verify this by taking a point on the graph and\\reflecting it.Let’s use the point \textcolor{#000099}{(1,1)}.First,reflect it across the\\\textcolor{#000099}{\mathit{x}}-axis to \textcolor{#000099}{(1,–1)}.Then reflect it across the \textcolor{#000099}{\mathit{y}}-axis to \textcolor{#000099}{(–1,–1)}.There\\is no point \textcolor{#000099}{(–1,–1)} on the graph,so this graph is not symmetric\\across the origin.}") → text1
AI Drawing Prompt Reference
Create a comprehensive math illustration showing a hexagon with points on its edges connected to form inner polygons, a set of quadrilaterals and triangles formed by segments, vectors from the origin along the axes, and additional triangles and segments. Include text labels explaining that the function is even and symmetric about the y-axis, with the equation f(x) = -x^2 + 2, along with definitions of function and symmetry, and instructional text about checking symmetry and solving problems.
The prompt above was compiled from the original drawing commands and is for reference only.