
Comprehensive Geometry and Function Example: Polygons, Parametric Curves, and Vo
Loading the math board and drawing, please wait…
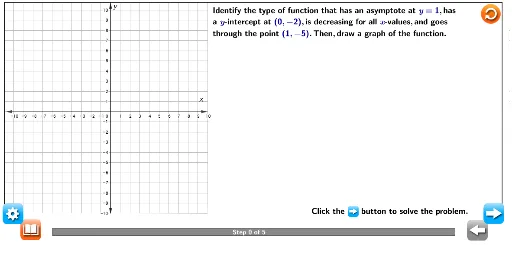
①This example demonstrates a comprehensive mathematical construction combining exponential functions, parametric curves, polygons, bar charts, and volume calculations, presented through an interactive GeoGebra interface. ②Core concepts include exponential function graphs, parametric curves, general quadrilaterals, vector subtraction, bar charts, and the geometric meaning of volume, bridging functions, geometry, and algebra. ③Construction: Based on the summary, commands such as Point, Segment, Intersect, Vector, LaTeX, and Polygon are used, with numerous objects (A to Z, P, Q, etc.) created, likely for dynamic graphics, buttons (Reset, Originalbutton), and interactive controls (probar) to adjust parameters or display states. ④Suitable for high school or early college students to explore the integration of functions and geometry, parametric representations, and intuitive understanding of volume, also useful for teachers creating interactive math lessons.
GeoGebra Commands & Parameters
Point(p_1) → P_1Point(xAxis) → BSegment(W, Z) → pIntersect(xAxis, yAxis) → D_1Point(yAxis) → E_1Vector(D_1, E_1) → wPoint(xAxis) → F_1Vector(D_1, F_1) → u_1Point(yAxis) → G_1Vector(D_1, G_1) → v_1Point(xAxis) → H_1Vector(D_1, H_1) → w_1LaTeX("\text{Identify the type of function.}") → text1_2LaTeX((("\text{Step {" * Slider) * "} of 5}")) → text1_5LaTeX("\text{\mathbf{Note}\mathbf{:} Use the (Data Kit) \\to return to the original \\problem or randomly generate \\a similar practice problem.\\Use the (Definition) to \\review words to know.}") → text2LaTeX("\text{Click the button to solve the problem.}") → text8LaTeX("\text{Draw the asymptote and the two given points on a coordinate plane.}") → text1_3Point(h_1) → J_1Point(h_1) → K_1Segment(J_1, K_1) → fPoint(i_1) → L_1Point(i_1) → M_1Segment(L_1, M_1) → asymptoteLaTeX((((((("\text{Identify the type of function that has an asymptote at \textcolor{#000099}{\mathit{y}={" * as) * "}},has\\a \textcolor{#000099}{\mathit{y}}-intercept at \textcolor{#000099}{(0, {") * y1) * "})},is decreasing for all \textcolor{#000099}{\mathit{x}}-values,and goes\\through the point \textcolor{#000099}{(1,{") * y2) * "})}.Then,draw a graph of the function.}")) → text1LaTeX("\text{Because there is an asymptote and a \textcolor{#000099}{\mathit{y}}-intercept,the function\\is exponential.}") → text1_1LaTeX((("\text{Asymptote at \textcolor{#000099}{\mathit{y}={" * as) * "}}")) → text3LaTeX("\text{\mathit{x}}") → text7LaTeX("\text{\mathit{y}}") → text7_1LaTeX("\text{\mathbf{Asymptote:} An asymptote is a value that you get closer and closer to,but\\ never quite reach.}") → text6LaTeX((("\text{\mathit{y}-intercepts:\textcolor{#000099}{(0,{" * y1) * "})}")) → text4LaTeX((("\text{Point goes through:\textcolor{#000099}{(0,{" * y2) * "})}")) → text5Polygon(N, Z_1, I_2, J_2, A_2, B_2, C_2, D_2, E_2, F_2, G_2, H_2) → poly1, n, h_2, i_2, j_2, z_1, a_2, b_2, c_2, d_2, e_2, f_2, g_2Point(n) → P_2Point(b_2) → S_2Polygon(K_2, L_2, M_2, N_2, O_2, P_2, Q_2, R_2, S_2) → poly2, k_2, l_2, m_2, n_2, o_2, p_2, q_2, r_2, s_2Intersect(a_2, b_2) → W_2Point(r_2) → Z_2Polygon(T_2, U_2, N_2, V_2, W_2, Z_2) → poly3, t_2, u_2, n_1, v_2, w_2, z_2LaTeX("\text{\mathbf{Point :} A point on the coordinate plane is a location defined by an \\ ordered pair of the form (x,y).}") → text6_1LaTeX("\text{Graph the given key features.}") → text1_4LaTeX("\text{Graph the function. \\Because the function is decreasing and can’t go beyond the asymptote,\\we can roughly draw in the curve required.}") → text1_6
AI Drawing Prompt Reference
Create a comprehensive mathematical diagram on a coordinate plane featuring an exponential function curve with its asymptote, marked y-intercept and a passing point; include a parametric curve; construct several polygons (quadrilaterals and hexagons) with vectors indicating displacements along axes; add a bar chart to illustrate volume; place text labels explaining function type, asymptote, intercepts, and include interactive buttons and sliders for step-by-step exploration.
The prompt above was compiled from the original drawing commands and is for reference only.