
Step Function and Unit Circle Example
Loading the math board and drawing, please wait…
This example demonstrates the graphical relationship between step functions and the unit circle. Key mathematical concepts include step functions, unit circle, and continuity. Using GeoGebra commands such as Polygon, Point, Segment, and Vector, the example constructs the graph of a step function and a dynamic demonstration of the unit circle. Suitable for high school mathematics education and learning.
GeoGebra Commands & Parameters
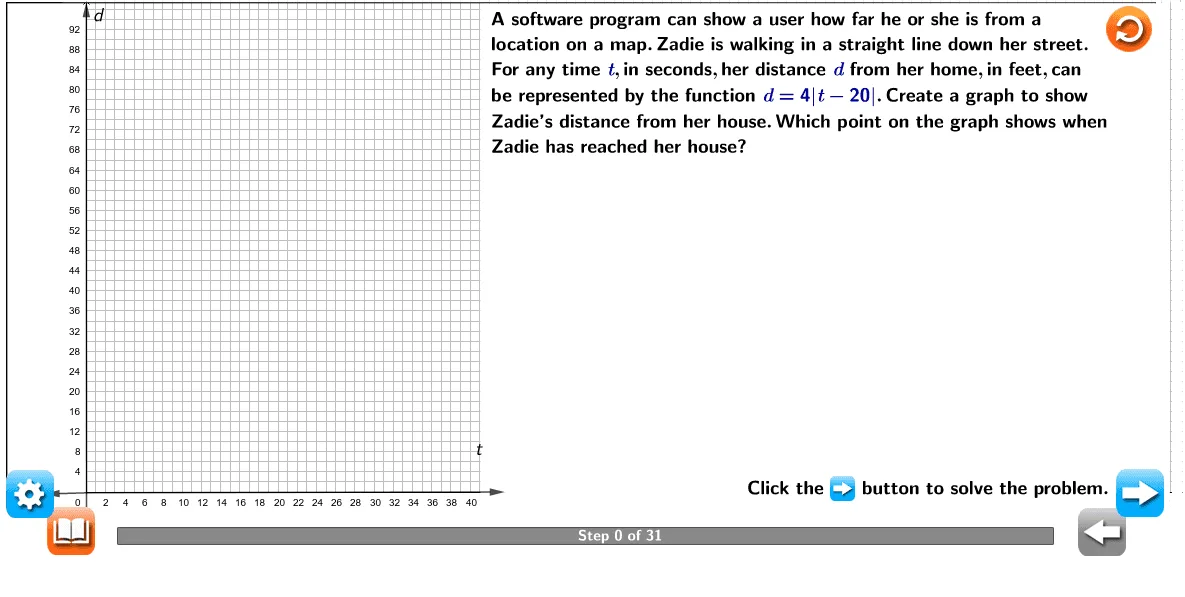
Polygon(A, B, C, D, E, F, G) → poly1, a_1, b_1, c, d, e, f, gPolygon(H, I, J, K) → q1, h, i, j, kPoint(k) → MSegment(L, M) → lVector(N, O) → uVector(N, R) → vPoint(xAxis) → SVector(N, S) → wVector(N, T) → mLaTeX("\text{Determine a domain for the problem statement.}") → text1_2LaTeX("\text{Determine the range for the given domain.}") → text1_4LaTeX("\text{Find the vertex of the graph of the absolute value function.}") → text1_5LaTeX("\text{Determine whether the vertex is a minimum or a maximum.}") → text1_{11}LaTeX("\text{Original function}") → text1_{18}LaTeX("\text{Original function}") → text1_{25}LaTeX("\text{Use the three points to create the graph of the function on the determined\\domain.}") → text1_{33}LaTeX("\text{Interpret the graph to find when Zadie will arrive at her house.}") → text1_{36}LaTeX((("\text{Step {" * Slider) * "} of 31}")) → text1_{37}LaTeX("\text{Click the button to solve the problem.}") → text2LaTeX("\text{Since the input,\textcolor{#000099}{\mathit{t}},is time,\textcolor{#000099}{\mathit{t}} can be greater than or equal to \textcolor{#000099}{0}.The domain is\\\textcolor{#000099}{\mathit{t} ≥ 0}.}") → text1_1LaTeX("\text{For the function \textcolor{#000099}{\mathit{d} = 4|\mathit{t} −20|,\mathit{a} > 0},and \textcolor{#000099}{\mathit{k} = 0}.The minimum of\\the range is \textcolor{#000099}{\mathit{d} = 0}.The range of the function is \textcolor{#000099}{\mathit{d} ≥ 0}.}") → text1_6LaTeX("\text{The coordinates of the vertex of the graph of an absolute value function are\\the values of \textcolor{#000099}{\mathit{h}} and \textcolor{#000099}{\mathit{k}} when the function is in standard form,\textcolor{#000099}{\mathit{y} = \mathit{a}|\mathit{x} − \mathit{h}| + \mathit{k}}.}") → text1_8LaTeX((("\text{Therefore,the coordinates of the vertex are \textcolor{#000099}{({" * b) * "}, 0)}.}")) → text1_7LaTeX((("\text{Thus,the vertex,\textcolor{#000099}{({" * b) * "}, 0)},is a minimum of the function.}")) → text1_{10}LaTeX("\text{Find at least two additional points on the graph.One should have an input\\less than the \textcolor{#000099}{\mathit{t}}-coordinate of the vertex,and the other should have an\\input greater than the \textcolor{#000099}{\mathit{t}}-coordinate of the vertex.}") → text1_9LaTeX((((("\text{\textcolor{#000099}{\mathit{d} = {" * a) * "}|\mathit{t} −{") * b) * "}|}}")) → text1_{14}LaTeX((((("\text{\textcolor{#000099}{\mathit{d} = {" * a) * "}|0 −{") * b) * "}|}}")) → text1_{16}LaTeX((((("\text{\textcolor{#000099}{\mathit{d} = {" * a) * "}|−{") * b) * "}|}}")) → text1_{15}LaTeX((((("\text{\textcolor{#000099}{\mathit{d} = {" * a) * "}({") * b) * "})}}")) → text1_{22}LaTeX((("\text{\textcolor{#000099}{\mathit{d} ={" * sum) * "}}}")) → text1_{21}LaTeX((("\text{The point at the minimum of the domain is \textcolor{#000099}{(0, {" * sum) * "})}.}")) → text1_{19}LaTeX((("\text{Evaluate the function at a value of \textcolor{#000099}{\mathit{t}} greater than \textcolor{#000099}{{" * b) * "}}.")) → text1_{24}LaTeX("\text{Let \textcolor{#000099}{\mathit{t} = 30}.}") → text1_{23}LaTeX((((("\text{\textcolor{#000099}{\mathit{d} = {" * a) * "}|\mathit{t} −{") * b) * "}|}}")) → text1_{26}LaTeX((((("\text{\textcolor{#000099}{\mathit{d} = {" * a) * "}|30−{") * b) * "}|}}")) → text1_{28}LaTeX((((("\text{\textcolor{#000099}{\mathit{d} = {" * a) * "}|{") * min) * "}|}}")) → text1_{27}LaTeX((((("\text{\textcolor{#000099}{\mathit{d} = {" * a) * "}({") * min) * "})}}")) → text1_{32}LaTeX((("\text{\textcolor{#000099}{d = {" * mul) * "}}")) → text1_{31}LaTeX((((("\text{A point with an input greater than \textcolor{#000099}{{" * b) * "}} is \textcolor{#000099}{(30, {") * mul) * "})}.}")) → text1_{34}LaTeX((((((("\text{Plot \textcolor{#000099}{(0, {" * sum) * "}), ({") * b) * "}, 0)},and \textcolor{#000099}{(30, {") * mul) * "})} on the domain \textcolor{#000099}{\mathit{t} ≥ 0}.An absolute value\\graph will have two rays with endpoints at the vertex.Each ray will go through\\the points less than and greater than the vertex.}")) → text1_{35}LaTeX((("\text{The \textcolor{#000099}{\mathit{y}}-value of the graph is Zadie’s distance from her house.When \textcolor{#000099}{\mathit{y} = 0},\\Zadie is at her house.Zadie will arrive at her house after \textcolor{#000099}{{" * b) * "}} seconds.}")) → text1_{38}Segment(U, V) → nFitLineY({V, W}) → pIntersect(p, n) → ZPoint(p) → A_1Vector(Z, W) → qLaTeX("\text{\mathit{d}}") → text4_1LaTeX("\text{\mathbf{Coordinate:} A coordinate is a number in an ordered pair that names the location\\ of a point on the coordinate plane. }") → text4_2LaTeX("\text{\mathbf{Graph:} A diagram showing the relation between variable quantities,typically\\ of two variables,each measured along one of a pair of axes at right\\ angles.}") → text4LaTeX("\text{\mathit{t}}") → text4_4LaTeX((((("\text{Function \textcolor{#000099}{\mathit{d}={" * a) * "|\mathit{t}-{") * b) * "}|}}}")) → text4_3LaTeX("\text{\mathbf{Note}\mathbf{:} Use the (Data Kit) \\to return to the original \\problem or randomly generate \\a similar practice problem.\\Use the (Definition) to \\review words to know.}") → text3LaTeX((((("\text{A software program can show a user how far he or she is from a\\location on a map.Zadie is walking in a straight line down her street.\\For any time \textcolor{#000099}{\mathit{t}},in seconds,her distance \textcolor{#000099}{\mathit{d}} from her home,in feet,can\\be represented by the function \textcolor{#000099}{\mathit{d} = {" * a) * "}|\mathit{t} −{") * b) * "}|}.Create a graph to show\\Zadie’s distance from her house.Which point on the graph shows when\\Zadie has reached her house?}")) → text1LaTeX("\text{For an absolute value function of the form \textcolor{#000099}{\mathit{y} = \mathit{a}|\mathit{x} − \mathit{h}| + \mathit{k}},there is one\\extreme value for the range at \textcolor{#000099}{\mathit{y} = \mathit{k}}.If \textcolor{#000099}{\mathit{a}} in the general form \textcolor{#000099}{\mathit{y} = \mathit{a}|\mathit{x} − \mathit{h}| + \mathit{k}}\\is positive,the extreme value is the minimum of the range,and there is no\\maximum of the range.If \textcolor{#000099}{\mathit{a}} in the general form \textcolor{#000099}{\mathit{y} = \mathit{a}|\mathit{x} − \mathit{h}| + \mathit{k}} is negative,\\the extreme value is the maximum of the range,and there is no\\minimum of the range.}") → text1_3LaTeX("\text{If \textcolor{#000099}{\mathit{a}} in the general form \textcolor{#000099}{\mathit{y} =\mathit{a}|\mathit{x} − \mathit{h}| + \mathit{k}} is positive,the vertex is a minimum\\of the function.If \textcolor{#000099}{\mathit{a}} in the general form \textcolor{#000099}{\mathit{y} =\mathit{a}|\mathit{x} − \mathit{h}| + \mathit{k}} is negative,the\\vertex is a maximum of the function.For the function \textcolor{#000099}{\mathit{d} = 4|\mathit{t} −20|, \mathit{a} > 0}.}") → text1_{12}LaTeX((("\text{The input value of the vertex is \textcolor{#000099}{\mathit{t} = {" * b) * "}}.The domain of the function is\\restricted to \textcolor{#000099}{\mathit{t} ≥ 0},since \textcolor{#000099}{\mathit{t}} represents time.Evaluate the function at \textcolor{#000099}{\mathit{t} = 0}\\to find the point at the minimum of the domain.This point has an input less\\than the input of the vertex.}")) → text1_{13}LaTeX("\text{Substitute \textcolor{#000099}{0} for \textcolor{#000099}{\mathit{t}}}.") → text1_{17}LaTeX("\text{Simplify.") → text1_{20}LaTeX("\text{Simplify}.") → text1_{29}LaTeX("\text{Substitute \textcolor{#000099}{30} for \textcolor{#000099}{\mathit{t}}}.") → text1_{30}
AI Drawing Prompt Reference
Draw a graph showing the relationship between a step function and a unit circle. First, draw the graph of a step function with several key points and line segments. Then, draw the unit circle and show its intersection with the x-axis. Finally, use a dynamic point to demonstrate how points on the unit circle move, and label the center and radius of the circle.
The prompt above was compiled from the original drawing commands and is for reference only.