
Lottery Ticket Decision
Loading the math board and drawing, please wait…
In collections
UCSS Secondary Math I Unit 4 Lesson 1
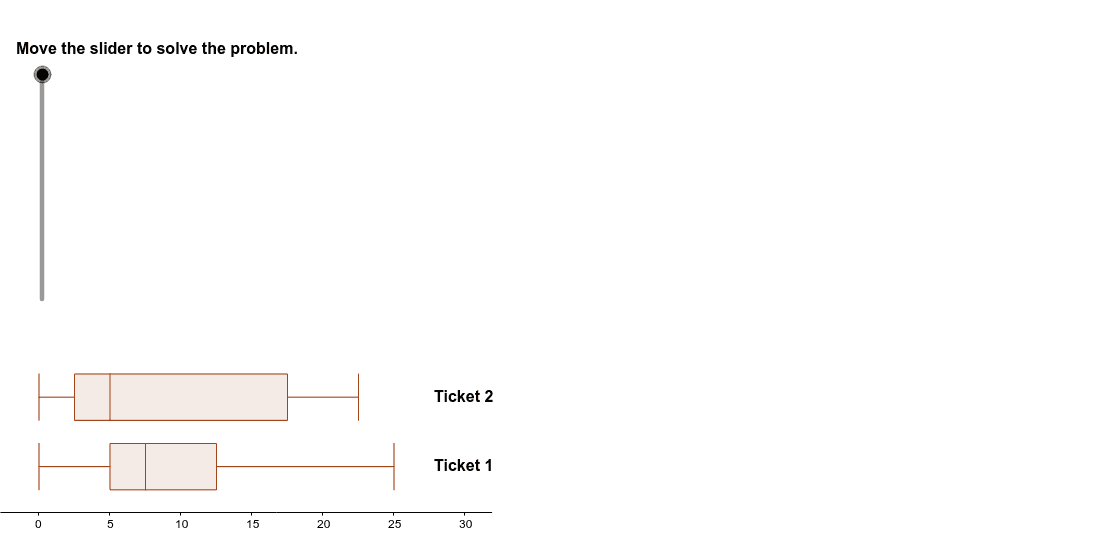
This example analyzes the probability of winning and cost of two lottery tickets to help students understand probability and decision-making. It uses BoxPlot and Polygon commands in GeoGebra, suitable for middle school math education.
GeoGebra Commands & Parameters
BoxPlot(2, 1, L1) → B1BoxPlot(5, 1, L2) → B2Polygon((32, y(Corner[1])), Corner[2], (x(Corner[3]), 2), (32, 2)) → Mask, a, b, c, d
AI Drawing Prompt Reference
Draw the profit situation of two lottery tickets with box plots. Then draw a rectangle to show the relationship between cost and profit. First, create a box plot for a 2-yuan ticket and another for a 5-yuan ticket. Next, draw a rectangle with its bottom on the x-axis, height of 2, and width covering the range of the two box plots.
The prompt above was compiled from the original drawing commands and is for reference only.