
Draw a Box Plot to Represent Data
Loading the math board and drawing, please wait…
In collections
UCSS Secondary Math I Unit 4 Lesson 1
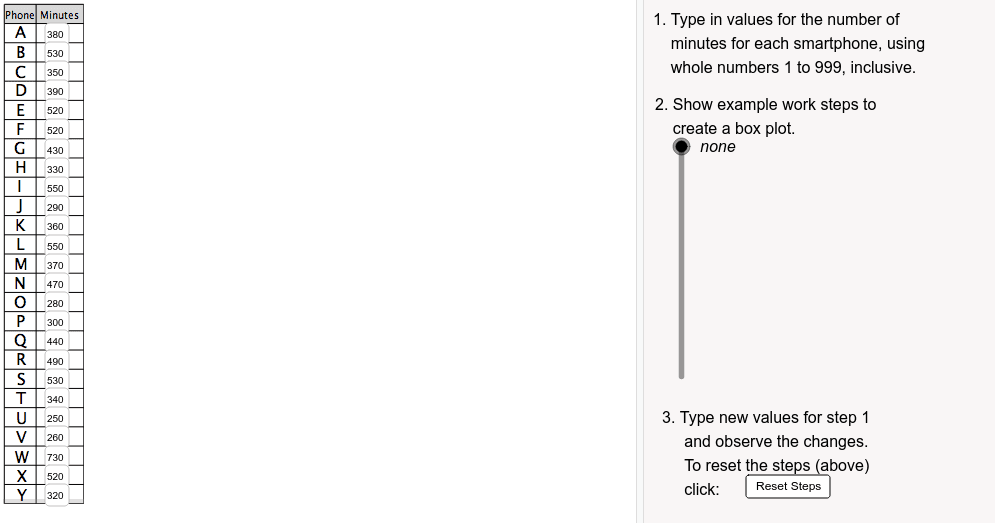
This example demonstrates how to draw a box plot to represent data. A box plot is a statistical chart that shows the distribution of a dataset, including the median, quartiles, and outliers. The example uses GeoGebra commands such as Sort, If, Textfield, Polygon, etc., for drawing. Suitable for Grade 9 students to learn data statistics and analysis.
GeoGebra Commands & Parameters
Sort({d1, d2, d3, d4, d5, d6, d7, d8, d9, d10, d11, d12, d13, d14, d15, d16, d17, d18, d19, d20, d21, d22, d23, d24, d25}) → orderedIf(Mod[50 * ceil(Element[ordered, 25] / 50), 1] ≠ 0, 50 * ceil((Element[ordered, 25] + 50) / 50), 50 * ceil(Element[ordered, 25] / 50)) → scaleMaxIf(floor(Element[ordered, 1] / 50) < 0, 0, 50 * floor(Element[ordered, 1] / 50)) → scaleMinTextfield(d1) → inputD1Polygon((0, 21), (If[showSteps > t0, t1, t2], 21), (If[showSteps > t0, t1, t2], 22), (0, 22)) → tableHeader, b, c, d, eSegment((0, 10), (If[showSteps > t0, t1, t2], 10)) → fSegment((0, 9), (If[showSteps > t0, t1, t2], 9)) → gSegment((0, 8), (If[showSteps > t0, t1, t2], 8)) → hSegment((0, 7), (If[showSteps > t0, t1, t2], 7)) → iSegment((0, 6), (If[showSteps > t0, t1, t2], 6)) → jSegment((0, 5), (If[showSteps > t0, t1, t2], 5)) → kSegment((0, 4), (If[showSteps > t0, t1, t2], 4)) → lSegment((0, 3), (If[showSteps > t0, t1, t2], 3)) → mTextfield(d2) → inputD2Textfield(d3) → inputD3Textfield(d4) → inputD4Textfield(d5) → inputD5Textfield(d6) → inputD6Textfield(d7) → inputD7Textfield(d8) → inputD8Segment((0, 2), (If[showSteps > t0, t1, t2], 2)) → aTextfield(d9) → inputD9Element(ordered, 9) → grSegment((0, -4), (If[showSteps > t0, t1, t2], -4)) → tSegment((0, -3), (If[showSteps > t0, t1, t2], -3)) → a_1Segment((0, -2), (If[showSteps > t0, t1, t2], -2)) → b_1Segment((0, 0), (If[showSteps > t0, t1, t2], 0)) → c_1Segment((0, -1), (If[showSteps > t0, t1, t2], -1)) → d_1Segment((0, 1), (If[showSteps > t0, t1, t2], 1)) → e_1Segment((0, 11), (If[showSteps > t0, t1, t2], 11)) → f_1Segment((0, 12), (If[showSteps > t0, t1, t2], 12)) → g_1Segment((0, 13), (If[showSteps > t0, t1, t2], 13)) → h_1Segment((0, 14), (If[showSteps > t0, t1, t2], 14)) → i_1Segment((0, 15), (If[showSteps > t0, t1, t2], 15)) → j_1Segment((0, 16), (If[showSteps > t0, t1, t2], 16)) → k_1Segment((0, 17), (If[showSteps > t0, t1, t2], 17)) → l_1Segment((0, 18), (If[showSteps > t0, t1, t2], 18)) → m_1Segment((0, 19), (If[showSteps > t0, t1, t2], 19)) → n_1Segment((0, 20), (If[showSteps > t0, t1, t2], 20)) → p_1Segment((0, -4), (0, 21)) → nSegment((1, -4), (1, 22)) → qSegment((If[showSteps > t0, t1, t2], -4), (If[showSteps > t0, t1, t2], 21)) → pTextfield(d10) → inputD10Textfield(d11) → inputD11Textfield(d12) → inputD12Textfield(d13) → inputD13Textfield(d14) → inputD14Textfield(d15) → inputD15Textfield(d16) → inputD16Textfield(d17) → inputD17Textfield(d18) → inputD18Textfield(d19) → inputD19Textfield(d20) → inputD20Textfield(d21) → inputD21Textfield(d22) → inputD22Textfield(d23) → inputD23Textfield(d24) → inputD24Textfield(d25) → inputD25Vector((10, 0), (-0.8, 0)) → xAxisLVector((10, 0), (20.8, 0)) → xAxisRSequence(Segment[(i, -0.3), (i, 0.3)], i, 0, 20) → xAxisHashMarksPolygon(((Q_1 - scaleMin) / scaleFactor, 1.5), ((Q_3 - scaleMin) / scaleFactor, 1.5), ((Q_3 - scaleMin) / scaleFactor, 4), ((Q_1 - scaleMin) / scaleFactor, 4)) → box, boxBottom, boxR, boxTop, boxLSegment(((Element[ordered, 13] - scaleMin) / scaleFactor, 1.5), ((Element[ordered, 13] - scaleMin) / scaleFactor, 4)) → boxMedianSegment(Minimum, ((Q_1 - scaleMin) / scaleFactor, 2.75)) → boxSeg1Segment(Maximum, ((Q_3 - scaleMin) / scaleFactor, 2.75)) → boxSeg2
AI Drawing Prompt Reference
Draw a box plot to represent a dataset, including the median, quartiles, and outliers. First, sort the data and determine the height range of the box plot based on the data range. Draw the horizontal and vertical axes in the coordinate system and label the data range on the vertical axis. Then, draw the box and whiskers of the box plot based on the sorted data, where the box represents the quartile range and the whiskers represent the outliers. Finally, add a title and axis labels above the box plot for better understanding of the data distribution.
The prompt above was compiled from the original drawing commands and is for reference only.