
Trefoil Knot Parametric Curve in 3D
Loading the math board and drawing, please wait…
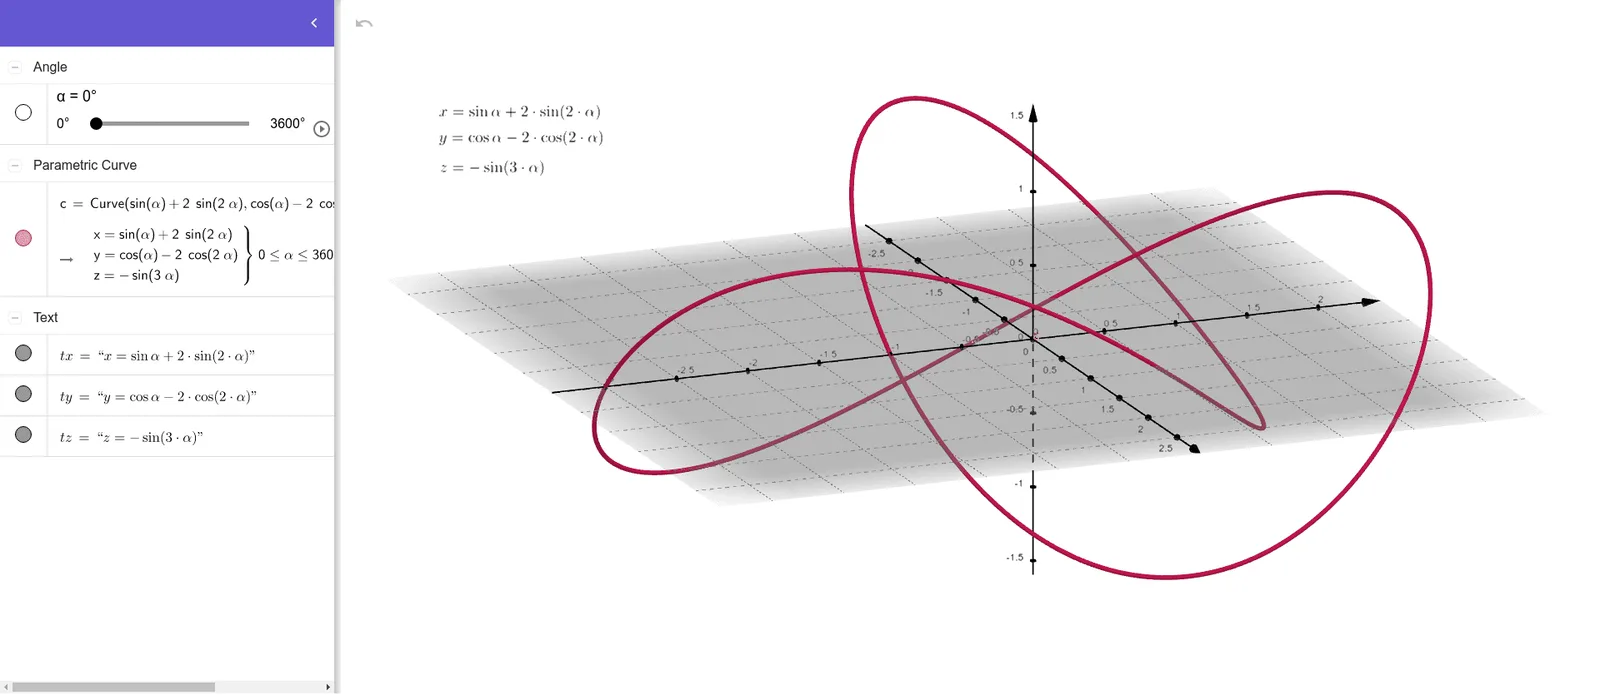
①This example demonstrates the classic trefoil knot, a closed curve with three crossings, using GeoGebra's 3D parametric curve plotting. ②Core mathematical concepts include parametric equations, three-dimensional space curves, knot theory in topology, and vector-valued functions describing spatial trajectories. ③Construction highlights: the CurveCartesian command is used with parameters α and coordinate functions tx, ty, tz to generate the curve; object c represents the final curve, and sliders can be added to animate parameter changes. ④Suitable for high school to undergraduate mathematics, especially for analytic geometry, calculus, or introductory topology, helping students visualize parametric curves and spatial geometry.
GeoGebra Commands & Parameters
CurveCartesian(sin(α) + (2 * sin((2 * α))), cos(α) - (2 * cos((2 * α))), (-sin((3 * α))), α, 0, 3600) → c
AI Drawing Prompt Reference
Draw a trefoil knot as a closed 3D parametric curve with three crossings. The curve is defined by parametric equations where the x-coordinate combines a sine term with twice the sine of double the angle, the y-coordinate combines a cosine term with twice the cosine of double the angle, and the z-coordinate is the negative sine of triple the angle. The parameter ranges from 0 to 3600 to ensure the curve closes smoothly. Show the curve's twisting and crossing structure clearly in three-dimensional space, optionally with coordinate axes for reference.
The prompt above was compiled from the original drawing commands and is for reference only.