
Sums of Rectangles
Loading the math board and drawing, please wait…
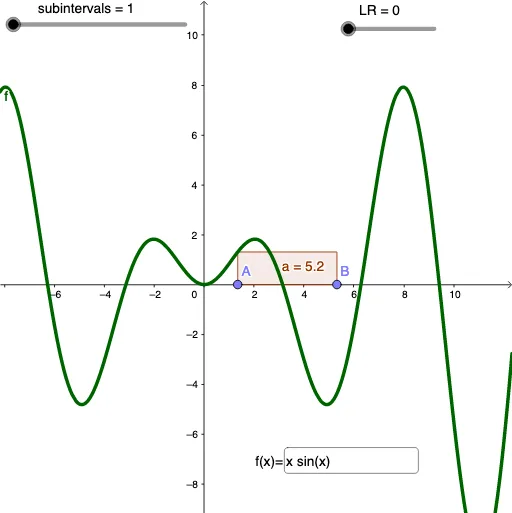
This example demonstrates approximating the area under a function curve using sums of rectangles, involving core calculus concepts like integration, limits, and 3D vectors. It constructs the visualization using commands like Point, Textfield, RectangleSum, and objects such as LR, subintervals, f, A, B, InputBox1, a, C, ShowHide. Ideal for high school and above students/teachers learning calculus and solid geometry.
GeoGebra Commands & Parameters
Point(xAxis) → APoint(xAxis) → BTextfield(f) → InputBox1RectangleSum(f, x(A), x(B), subintervals, LR) → a
AI Drawing Prompt Reference
Draw a function curve with multiple rectangles approximating the area under it, illustrating concepts of integration and limits. Include two points on the x-axis, an input box for the function expression, and the sum of rectangles representing the approximate area. Start by plotting the x-axis and function, then add rectangles, and finally display the overall effect.
The prompt above was compiled from the original drawing commands and is for reference only.