
Student-t vs. Z Distribution Demo
Loading the math board and drawing, please wait…
In collections
Statistics Demonstrations
Statistics Demonstrations
Statistics Demonstrations
Statistics Demonstrations
Statistics Demonstrations
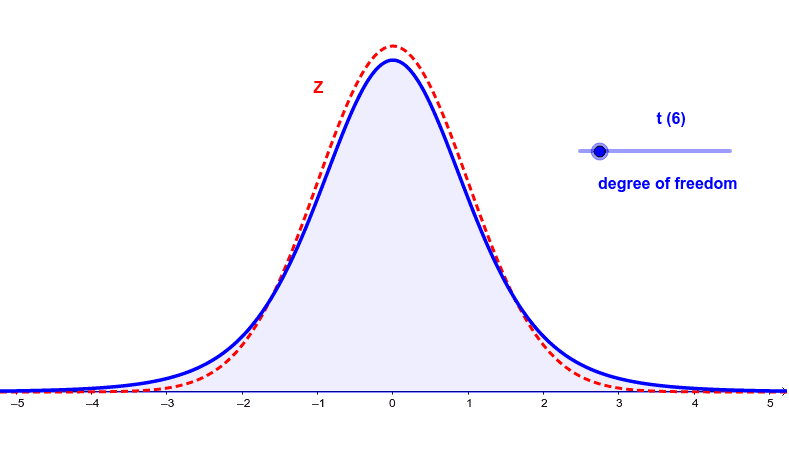
This example demonstrates the comparison between the student-t distribution curve and the standard normal distribution curve. It involves core mathematical concepts such as probability & statistics, normal distribution, and t-distribution. The construction uses commands like Normal, TDistribution, and Integral, with objects including f, df, g, a, text1, text2, text3. It is suitable for high school students and statistics enthusiasts.
GeoGebra Commands & Parameters
Normal(0, 1, x) → fTDistribution(df, x) → gIntegral(g, -10, 10) → a
AI Drawing Prompt Reference
Draw a comparison graph of the standard normal distribution curve and the t distribution curve, where the t distribution curve includes a degrees of freedom parameter, and calculate the integral of the t distribution curve from -10 to 10, label the normal distribution curve as f, the t distribution curve as g, and the integral area as a to show their relationship.
The prompt above was compiled from the original drawing commands and is for reference only.