
Stretching the y=1/x graph
Loading the math board and drawing, please wait…
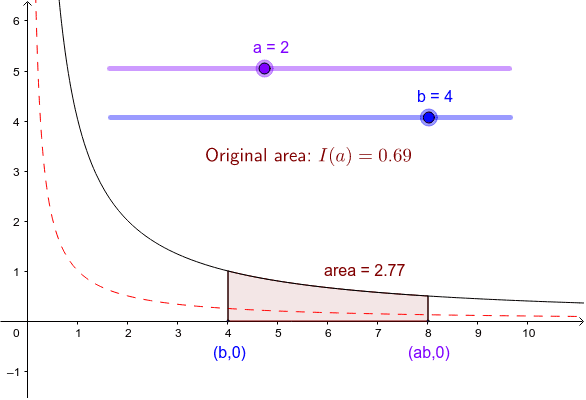
This example demonstrates how to transform the y=1/x function graph through integral manipulation. Key math concepts include function graph transformation, integral calculation, and logarithmic function properties. GeoGebra commands/objects used in construction are Segment (line segment) and Integral (integral). Suitable for high school and above students to understand the geometric meaning of function integration and transformation.
GeoGebra Commands & Parameters
Segment(A, B) → cSegment(C, D) → dIntegral(f, b, (a * b)) → areaIntegral(g, 1, a) → origarea
AI Drawing Prompt Reference
Draw a coordinate plane showing the graph of y=1/x in the first quadrant. Above the curve, construct a rectangle bounded by two horizontal and two vertical line segments, extending from x-coordinate b to the product of a and b, and shade this region to represent the definite integral of the function over that interval. Below the curve, from x=1 to x=a, shade another region bounded by the curve and the axes, representing the original integral. Clearly label both shaded areas to illustrate how the function graph is stretched through integral manipulation.
The prompt above was compiled from the original drawing commands and is for reference only.