
Step-by-Step Modified Boxplot Construction
Loading the math board and drawing, please wait…
In collections
Statistics Step Through Applets
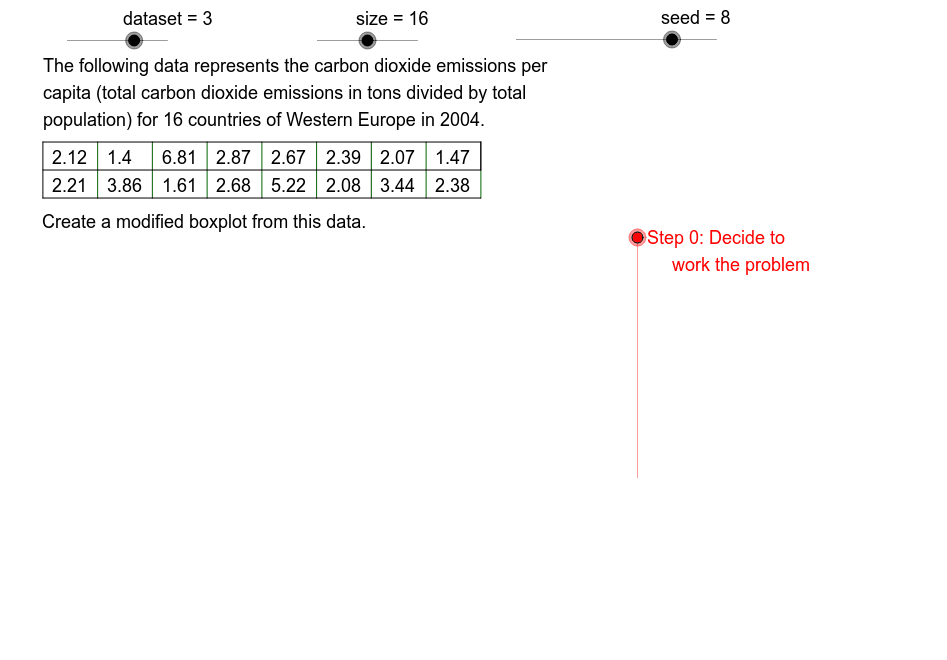
This example demonstrates how to construct a modified boxplot step-by-step. It guides students through the interactive process of building a boxplot. Key math concepts involved include dataset analysis, quartiles (Q1, Q3), median, interquartile range (IQR), and outlier handling. The construction utilizes GeoGebra commands like Element, Sequence, Min, Max, If, Q3, Q1, Sort, Median, Intersection, CountIf, KeepIf, Segment, Midpoint, Union, along with objects such as DS1, DS2, DS3, DS4, dataset, QHi, QLo, IQR. Suitable for high school students learning data visualization and statistical analysis.
GeoGebra Commands & Parameters
Element(DSSq, dataset) → DS0Element(PrmSq, seed) → RateSequence(Element[DS0, Mod[4 + (Rate * k), 20] + 1], k, 1, size) → SampleMin(Sample) → OldMinMax(Sample) → OldMaxIf((5 * SFLB) ≤ SFUB, (5 * SFLB), If[(2 * SFLB) ≤ SFUB, (2 * SFLB), SFLB]) → SFElement(AcSq, dataset) → AccQ3(Sample) → QHiQ1(Sample) → QLoSequence(k, k, OldMin, OldMax, Acc) → DomainSort(Intersection[Domain, Sample]) → RangeMedian(Sample) → Med1Sequence(k, k, (ceil(LoFn / Acc) * Acc), (floor(UpFn / Acc) * Acc), Acc) → MiddleIntersection(Sample, Middle) → GoodDataMin(GoodData) → NewMinCountIf(x < LoFn, Range) → LfOtlrCntRngMax(GoodData) → NewMaxCountIf(x > UpFn, Range) → RtOtlrCntRngKeepIf(x > UpFn, Range) → DmAbFnCountIf(x ≤ OldMax, Range) → RngCntSegment(AxLE, AxRE) → axisSegment(NMinT, NMinB) → nwminMidpoint(nwmin) → NMinMSegment(QLoT, QLoB) → qloSegment(MedT, MedB) → medMidpoint(qlo) → QLoMSegment(NMinM, QLoM) → lfwhSegment(QHiT, QHiB) → qhiSegment(QLoT, QHiT) → boxtopSegment(QLoB, QHiB) → boxbotSegment(NMaxT, NMaxB) → nwmaxMidpoint(nwmax) → NMaxMMidpoint(qhi) → QHiMSegment(QHiM, NMaxM) → rtwhKeepIf(x < LoFn, Range) → LfOtlrVlsCountIf(x > UpFn, Sample) → RtOtlrCntCountIf(x < LoFn, Sample) → LfOtlrCntKeepIf(x < LoFn, Range) → DmBlFnElement(DDSq, dataset) → DD0Segment(TbUL, TbUR) → tbtpSegment(TbML, TbMR) → tbmdSegment(TbLL, TbLR) → tbbtSegment(TbUL, TbLL) → tblfSegment(TbUR, TbMR) → tbrtSequence(Segment[(TbLf + (k * TbCW), TbTp), (TbLf + (k * TbCW), TbTp - (2 * TbCH))], k, 1, DtRL2) → TbDLSqSequence(Text[k, (adp(k) - 1, AxHt - 0.07)], k, AxMin, AxMax, SF) → AxLbSqSequence(Segment[(adp(k), AxHt + 0.01), (adp(k), AxHt - 0.01)], k, AxMin, AxMax, SF) → AxTcSqSequence((adp(Element[DmAbFn, k]), AxHt + 0.2), k, 1, RtOtlrCntRng) → RtOtlrSequence((adp(Element[LfOtlrVls, k]), AxHt + 0.2), k, 1, LfOtlrCntRng) → LfOtlrSqSequence(Text[Element[Sample, k], (TbLf - 5 + (k * 6), TbTp - 0.08)], k, 1, DtRL1) → DRw1Sequence(Text[Element[Sample, k + DtRL1], (TbLf - 5 + (k * 6), TbTp - TbCH - 0.08)], k, 1, DtRL2) → DRw2If(QLo < 0, IQRNQL, IQRPQL) → IQRCmTxKeepIf(x > UpFn, Range) → RtOtlrVlsUnion(RtOtlrVls, LfOtlrVls) → OutliersElement(UntSq, dataset) → Unt0Element(TtlSq, dataset) → Ttl0
AI Drawing Prompt Reference
Draw a modified boxplot to illustrate dataset analysis, quartiles, median, interquartile range, and outlier handling. Start by plotting data points, identifying the minimum and maximum values, then locate the quartiles and median, draw the box and whiskers, and finally mark the outliers. The process should demonstrate the step-by-step construction of the boxplot.
The prompt above was compiled from the original drawing commands and is for reference only.