
Solving Linear Systems by Graphing: REVAMPED
Loading the math board and drawing, please wait…
In collections
A1.ACE.1 - Create and solve equations and inequalities
Systems of Linear Equations
Systems of Linear Equations
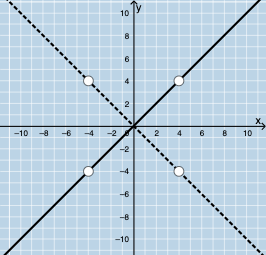
This GeoGebra example demonstrates how to solve a system of linear equations by graphing two lines and identifying their intersection point, which represents the solution. The core mathematical concepts include linear equations, linear functions, intersection of lines, and the graphical method of solving systems. The construction uses commands such as Random to generate random coefficients, Line to draw the lines, Sequence and Union to build sets of points, RandomElement to pick random elements, Slope to compute slopes, FractionText to display fractions, Textfield and InputBox for interactive input, Segment to create segments, and buttons (button1, button2) to trigger dynamic updates. It is suitable for middle school to high school students learning graphical solutions of linear systems, either in classroom demonstrations or self-exploration, helping them connect algebraic solutions with geometric representations.
GeoGebra Commands & Parameters
Random(-10, 10) → aRandom(-10, 10) → bRandom(-10, 10) → cLine(A, B) → fSequence(i, i, -10, y(B) - 1, 1) → dlowerSequence(i, i, y(B) + 1, 10, 1) → dupperUnion(dlower, dupper) → dlistRandomElement(dlist) → dLine(A, C) → gSlope(f) → eSlope(g) → hFractionText(e) → text1FractionText(h) → text2Line(D, E) → iLine(G, F) → jTextfield(k) → InputBox1Textfield(l) → InputBox2Segment(H, I) → mSegment(J, K) → n
AI Drawing Prompt Reference
Draw a coordinate plane for demonstrating the graphical solution of a linear system. Generate two random lines, each passing through a distinct fixed point and having a random slope. Above and below each line, mark discrete points at integer y-coordinates, then randomly select one point from each set to construct two additional auxiliary lines. Display the slopes of the two main lines as fractions. Add two text input fields for entering values. Draw two segments connecting relevant points to highlight the intersection or key structure. The overall layout should clearly show the intersection point of the two lines, representing the solution to the system.
The prompt above was compiled from the original drawing commands and is for reference only.