
Smoke Detector Simulation (1-prop z)
Loading the math board and drawing, please wait…
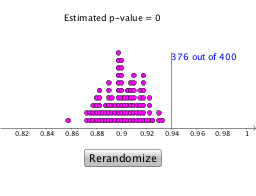
This example demonstrates the calculation and visualization of normal distribution probabilities in a smoke detector scenario, focusing on the standard normal distribution (Z-score) and cumulative distribution function. Key mathematical concepts include normal distribution, Z-scores, and cumulative distribution. It is constructed using GeoGebra commands like Sequence, DotPlot, Segment, and Point, with objects such as list1, list2, button1, f, A, text1, text2. Suitable for high school and above students learning probability statistics and inferential statistics to understand the application of normal distribution.
GeoGebra Commands & Parameters
Sequence(RandomBinomial[400, 0.9] / 400, n, 1, 100) → list1DotPlot(list1, false, 0.2) → list2Segment((376 / 400, 0), (376 / 400, 2)) → fPoint(f) → A
AI Drawing Prompt Reference
Visualize a smoke detector scenario showing normal distribution probability calculations, including Z-scores and cumulative distribution functions. Display 100 data points from a random binomial distribution, mark the value 376/400 with a point, and connect this point to the y-axis at height 2 with a line segment.
The prompt above was compiled from the original drawing commands and is for reference only.