
Smith Chart (Abaque de Smith) Interactive Demo
Loading the math board and drawing, please wait…
In collections
complex-numbers
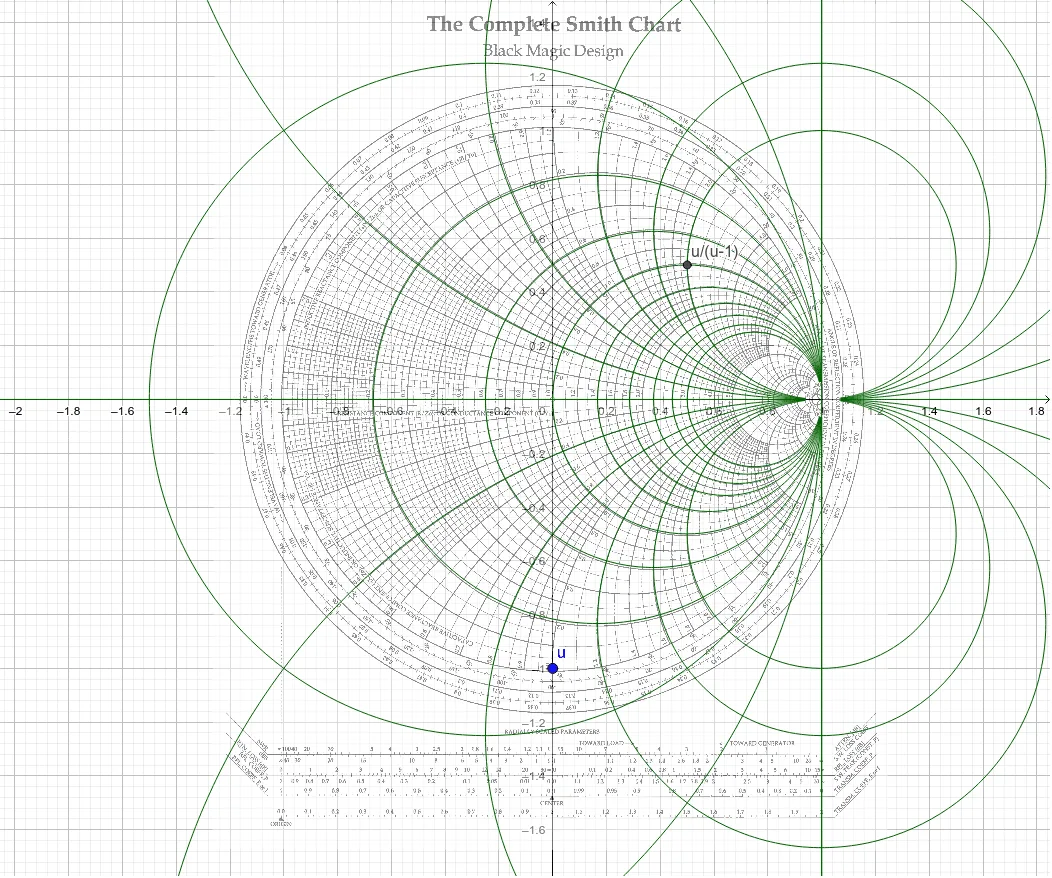
① This example demonstrates the classic Smith chart, a polar-coordinate graphical tool widely used in RF and microwave engineering for impedance matching and reflection coefficient analysis. ② Core mathematical concepts include complex numbers, coordinate transformations in the complex plane, logarithmic functions for scale compression, and set-theoretic point mappings; the construction uses a Sequence command to generate families of contour lines that map complex impedance to reflection coefficients. ③ Construction highlights: from the summary, the GeoGebra commands involve Sequence, with objects A, B, image1 (a background image), u (likely a vector or parameter), L_1 and L_2 (two curves or loci), and the complex number z_1; these elements together build the Smith chart grid and sample points. ④ Suitable for university-level electromagnetics, microwave engineering, or complex analysis courses, and also useful as an extension for high-school students learning complex numbers and coordinate geometry, providing an intuitive view of complex numbers in engineering applications.
GeoGebra Commands & Parameters
Sequence(CurveCartesian[real(1 + 1 / (k / 5 + (ί * b) - 1)), imaginary(1 + 1 / (k / 5 + (ί * b) - 1)), b, -15, 15], k, -5, 5) → L_1Sequence(CurveCartesian[real(1 + 1 / ((ί * k / 5) + b - 1)), imaginary(1 + 1 / ((ί * k / 5) + b - 1)), b, -15, 15], k, -5, 5) → L_2