
Whale’s Bubble Spiral: Angle-Controlled Parametric Curve
Loading the math board and drawing, please wait…
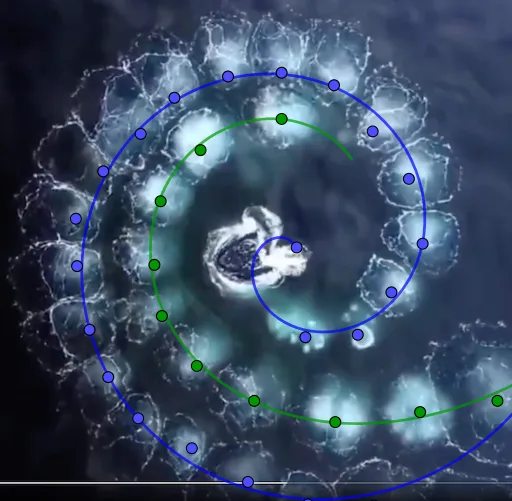
This example demonstrates a “whale-bubble” spiral visualization: an angle-driven process generates a winding, layered spiral curve that resembles rising bubbles. The key math ideas are parametric curve construction, using angles to control the geometric relationships, curve fitting to obtain a smooth spiral from sampled points, and Cartesian coordinate graphing. Construction (from the provided GeoGebra commands): Angle is used to define/measure the controlling angular relationships; Fit is applied to approximate a smooth curve based on constructed points; CurveCartesian is used to generate and display the curve in a Cartesian setting. Many point objects (e.g., A-, B- sets and their numbered variants) serve as discrete samples or intermediate construction points that feed into the spiral’s fitted curve. Suitable for high school through introductory university use in geometry construction, parametric equations, and mathematical visualization.
GeoGebra Commands & Parameters
Angle(C + (1, 0), C, A1) → B1Fit(C1:C20, {1, x, x^(2)}) → fAngle(C + (1, 0), C, D1) → E1Fit(F1:F20, {1, x, x^(2), x^(3)}) → gCurveCartesian((ℯ^(g(u)) * cos(u)), (ℯ^(g(u)) * sin(u)), u, 1, 6) → bCurveCartesian((f(u) * cos(u)), (f(u) * sin(u)), u, 2, 12) → a
AI Drawing Prompt Reference
Draw a whale-bubble spiral curve controlled by angles. First, define the relationships between control points using angles, then use polynomial fitting to generate a smooth curve. Finally, use exponential functions and angles to create the spiral curve, drawing from start to end.
The prompt above was compiled from the original drawing commands and is for reference only.