
Slope of Sine Function
Loading the math board and drawing, please wait…
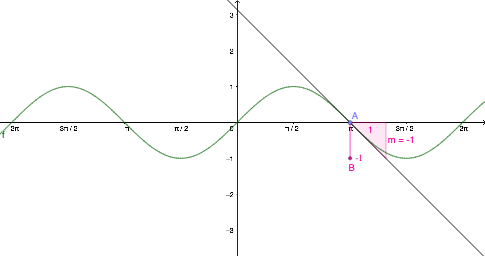
This example demonstrates the slope of the sine function at a specific point. The sine function is a trigonometric function, and its slope indicates the rate of change at that point. The construction involves using GeoGebra commands such as Point, Tangent, Slope, and Segment to create the function graph, tangent line, and slope value. It is suitable for high school mathematics to understand trigonometric function properties and derivative concepts.
GeoGebra Commands & Parameters
Point(f) → ATangent(A, f) → gSlope(g) → mSegment(B, C) → h
AI Drawing Prompt Reference
Plot the graph of the sine function y=sin(x), select a point on the curve, draw the tangent line through that point, display the slope value of the tangent line, and use a horizontal line segment to illustrate the numerical value of the slope, with coordinate axes and grid for reference.
The prompt above was compiled from the original drawing commands and is for reference only.