
Sketching and Analyzing Parabolas in Polar Coordinates
Loading the math board and drawing, please wait…
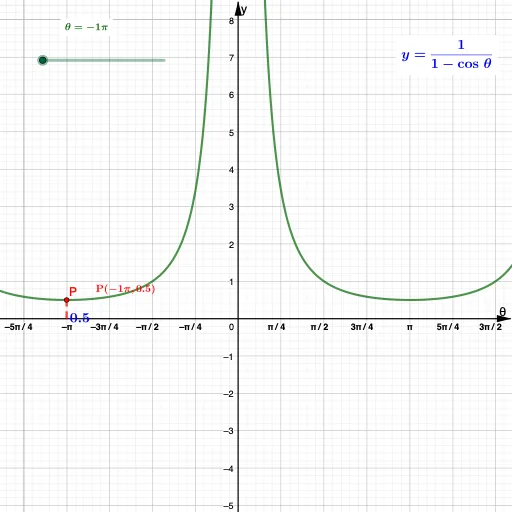
This example demonstrates the construction and visualization of a parabola within a polar coordinate system. It focuses on the mathematical relationship between polar equations and conic sections, specifically the definition of a parabola relative to its focus and directrix. The construction utilizes GeoGebra commands such as CurveCartesian for the primary curve, along with Point, Intersect, Angle, and Segment for geometric scaffolding. The use of Rotate and Midpoint commands ensures precise symmetry. This tool is ideal for high school or early college students studying analytic geometry, polar coordinates, and the properties of conic sections.
GeoGebra Commands & Parameters
FractionText(b) → text1Point(xAxis) → AIntersect(xAxis, yAxis) → OAngle(A, O, P') → αSegment(O, P') → gAngularBisector(A, O, P') → hPoint(h) → CMidpoint(O, P') → BSegment(E, P) → iMidpoint(E, P) → FCurveCartesian((f(θ); θ), θ, 0, (2 * 3.141592653589793)) → jCurveCartesian((1 / (1 - cos(t)) * cos(t)), (1 / (1 - cos(t)) * sin(t)), t, (-π), π) → dRotate(A, (-(180°)), O) → A'Angle(A', O, A) → β
AI Drawing Prompt Reference
Draw a parabola in polar coordinates with the focus at the pole and a vertical directrix. Plot the curve given by r = 1/(1−cosθ). Mark a point on the polar axis, an arbitrary point on the curve, and its reflection across the polar axis. Connect the focus to the curve point, draw the angle bisector between this segment and the polar axis, and indicate the midpoints of both the segment and the reflected segment to illustrate the geometric definition and symmetry of the parabola.
The prompt above was compiled from the original drawing commands and is for reference only.