
Binomial & Inverse Binomial Probability Calculator (Bar Chart Visualization)
Loading the math board and drawing, please wait…
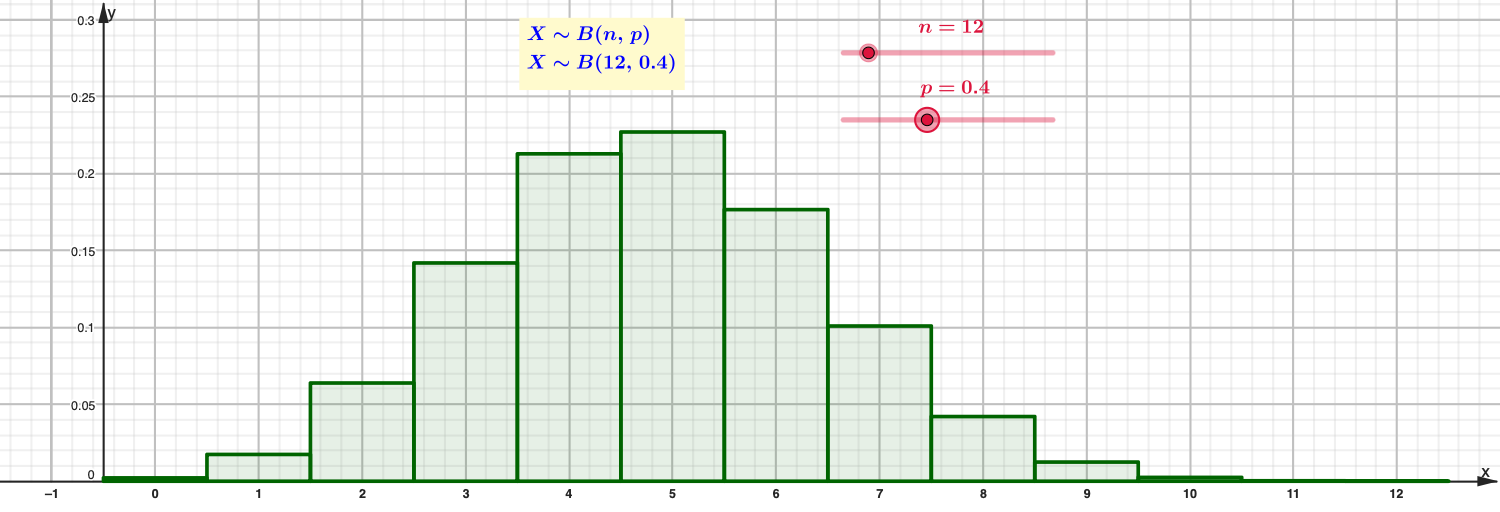
This example demonstrates how the binomial distribution’s probability mass function (PMF) changes with parameters and how the “inverse binomial” concept solves the corresponding inverse problem (e.g., finding the smallest number of trials or the appropriate value that matches a target cumulative/tail probability condition). It centers on binomial probability computation Binomial(n,p), visualization via a probability distribution bar chart, and inverse binomial calculations to obtain a quantile-like answer under a specified probability constraint. Construction in GeoGebra uses BinomialDist to generate the binomial PMF values, BarChart to plot the probabilities, and InverseBinomial to compute the reverse result; Graph together with multiple text/label objects (e.g., text1–text14) are used to present parameters and computed outputs while n and p are treated as interactive inputs. Suitable for high school through introductory college probability & statistics lessons, especially for probability visualization and teaching inverse probability/quantile-type reasoning.
GeoGebra Commands & Parameters
BinomialDist(n, p_{1}, false) → GraphBinomialDist(n, p_{1}, d, false) → eBarChart(a - 0.5, b + 0.5, Sequence[((nCr[n, r] * p_{1}^(r)) * (1 - p_{1})^(n - r)), r, a, b]) → cBarChart(0 - 0.5, a + 0.5, Sequence[((nCr[n, r] * p_{1}^(r)) * (1 - p_{1})^(n - r)), r, 0, a]) → fBarChart(b - 0.5, n + 0.5, Sequence[((nCr[n, r] * p_{1}^(r)) * (1 - p_{1})^(n - r)), r, b, n]) → gInverseBinomial(n, p_{1}, p) → kBarChart(0 - 0.5, k + 0.5, Sequence[((nCr[n, r] * p_{1}^(r)) * (1 - p_{1})^(n - r)), r, 0, k]) → lInverseBinomial(n, p_{1}, 1 - q) → mBarChart(m - 0.5, n + 0.5, Sequence[((nCr[n, r] * p_{1}^(r)) * (1 - p_{1})^(n - r)), r, m, n]) → o
AI Drawing Prompt Reference
Create a visualization showing how the binomial distribution's probability mass function changes with parameters, using bar charts. Also, illustrate the inverse binomial calculation to find the minimum number of trials or appropriate value meeting a specific probability condition. Include multiple bar charts representing probability distributions under different parameters and the computed inverse distribution results, with text annotations for parameters and outputs.
The prompt above was compiled from the original drawing commands and is for reference only.