
Sine Function Bounding Box
Loading the math board and drawing, please wait…
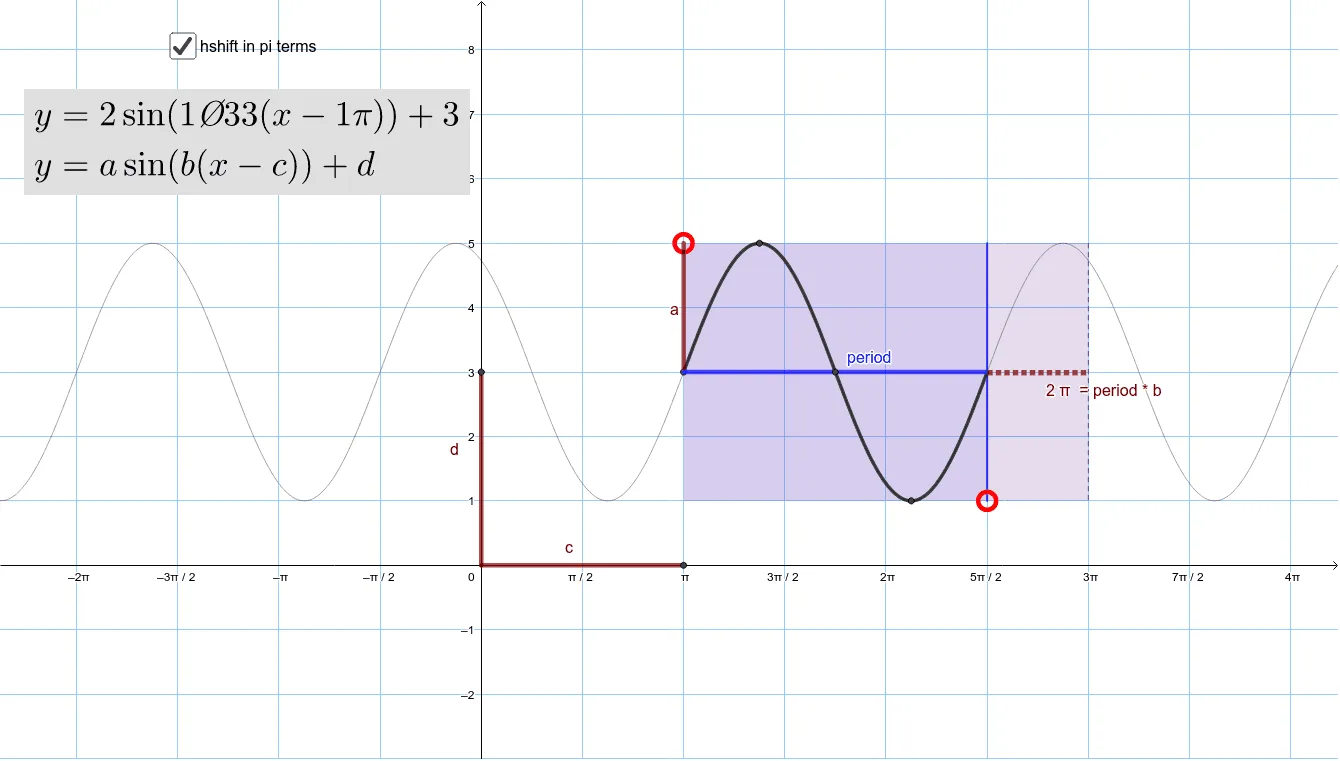
This example demonstrates how to construct the bounding box of a sine function to visualize its geometric properties. It involves core math concepts like trigonometry, coordinate geometry, geometric transformations, and function graphing. Key GeoGebra commands and objects used include Polygon, Intersect, Segment, Min, Max, Midpoint, and FractionText. Suitable for high school and above students to understand the geometric representation and transformations of function graphs.
GeoGebra Commands & Parameters
Polygon(A, C, B, D) → q1, a_1, c_1, b_1, d_1Intersect(f, a_1, (3.141592653589793, 3)) → EIntersect(f, b_1, (7.853981633974483, 2.9999999999999996)) → FSegment(E, F) → perSegment((0, 0), (x(A), 0)) → cSegment(E, A) → aPolygon(A, I, H, C) → q2, a_2, i, h, c_2Segment(J, K) → jIntersect(k, b_1) → MSegment(M, K) → gSegment((0, 0), N) → dMin(p, x(A), x(B)) → LMax(p, x(A), x(B)) → OMidpoint(A, B) → PFractionText(hshift / π) → text2
AI Drawing Prompt Reference
Draw a sine curve and construct its bounding rectangle. Find the intersection points of the curve with the rectangle's vertical sides, and connect them with a vertical segment. Draw a horizontal segment from the origin to the rectangle's bottom side, and a slanted segment from an intersection point to a rectangle vertex. Inside the rectangle, construct a smaller rectangle and draw its diagonal. Finally, mark the midpoint of the rectangle's bottom side and display a fraction text showing the horizontal shift divided by pi.
The prompt above was compiled from the original drawing commands and is for reference only.