
Scale Factor Fraction Demo
Loading the math board and drawing, please wait…
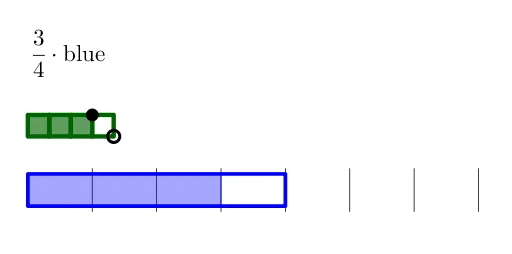
This example demonstrates the effect of scale factors on polygon scaling, visually showing the construction process of similar figures. It involves core mathematical concepts like scale factors, similar polygons, fraction operations, and coordinate geometry. Key GeoGebra commands used include Sequence, Length, Point, Polygon, and Slider to dynamically adjust the scale factor and observe graphical changes. Suitable for high school students to understand the connection between similarity transformations, function graphs, and geometric constructions, as well as for teaching graphical scaling in calculus.
GeoGebra Commands & Parameters
Sequence(Polygon[(k, 0), (k + 1, 0), 4], k, 0, 11) → l1Length(l1) → aSequence(15) → l2Sequence((l2(k), 3), k, 1, Length[l2]) → l4Point(l4) → ASequence((k, 4), k, 0, Min[24, Max[12, (2 * myDenom)]]) → l5Point(l5) → BSequence(Polygon[(k, 3), (k + 1, 3), 4], k, 0, myDenom - 1) → l6Sequence(Polygon[(k, 3), (k + 1, 3), 4], k, 0, myNumer - 1) → l7Sequence(Polygon[(k, 0), (k + 1, 0), 4], k, 0, c - 1) → l8Polygon({(0, -0.25), (c, -0.25), (c, 1.25), (0, 1.25)}) → q1Sequence(Segment[((k * firstLine), -0.5), ((k * firstLine), 1.5)], k, 1, 24) → l9Polygon({(0, -0.25), (a, -0.25), (a, 1.25), (0, 1.25)}) → q2