
Sinc Function
Loading the math board and drawing, please wait…
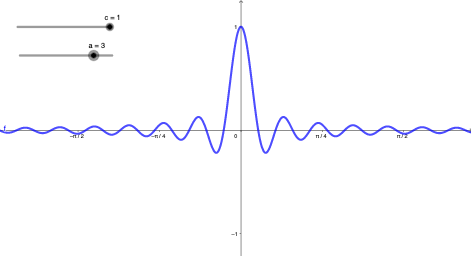
This example demonstrates the graph of the Sinc function, which is important in signal processing and mathematical analysis. By adjusting parameters, you can observe changes in the function's graph. This example uses GeoGebra's function graphing feature, suitable for high school mathematics education and learning.
GeoGebra Commands & Parameters
Numeric c(1)Numeric a(3)f(x) = ((c * sin((((2 * π) * a) * x)))) / (((2 * π) * (a * x)))
AI Drawing Prompt Reference
Plot the sinc function graph with parameter c set to 1 and a set to 3. The function expression is: f(x) = (c * sin((2 * π * a * x))) / (2 * π * a * x). Adjust parameters a and c to observe changes in the graph.
The prompt above was compiled from the original drawing commands and is for reference only.