
Set Operations on Venn Diagrams
Loading the math board and drawing, please wait…
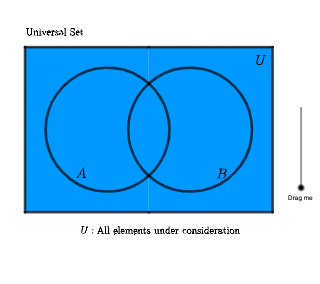
This example demonstrates set operations on Venn diagrams, involving set theory and conditional probability. Using GeoGebra commands such as Point, Circle, and Intersect, it dynamically illustrates set operations like intersection, union, and complement. Suitable for high school mathematics education and learning.
GeoGebra Commands & Parameters
Point(xAxis) → CCircle(C, A) → cPoint(xAxis) → DCircle(D, B) → dIntersect(c, d, 2) → EIntersect(c, d, 1) → FCircleArc(C, E, F) → c2CircleArc(D, F, E) → c3CircleArc(C, F, E) → c4CircleArc(D, E, F) → c1Point(l1) → GLocus(G1, G) → loc1Point(l2) → HPoint(l3) → ILocus(I1, I) → loc3Midpoint(J, L) → NMidpoint(K, M) → OSegment(E, N) → fSegment(N, L) → gPoint(g) → PSegment(P, M) → hPoint(h) → QSegment(Q, O) → iSegment(O, F) → jSegment(J, N) → kSegment(J, K) → lSegment(K, O) → mPoint(l5) → RLocus(R1, R) → loc4Point(l6) → SLocus(S1, S) → loc5Locus(H1, H) → loc2
AI Drawing Prompt Reference
Draw two intersecting circles and connect their intersection points and boundaries with arcs to form a Venn diagram's union and intersection parts. Add several points and line segments to represent conditional probability calculations, including midpoints, connecting lines, and dynamic loci, to visualize set operations.
The prompt above was compiled from the original drawing commands and is for reference only.