
Scatter Diagram Construction Problems
Loading the math board and drawing, please wait…
In collections
Charts & Graphs
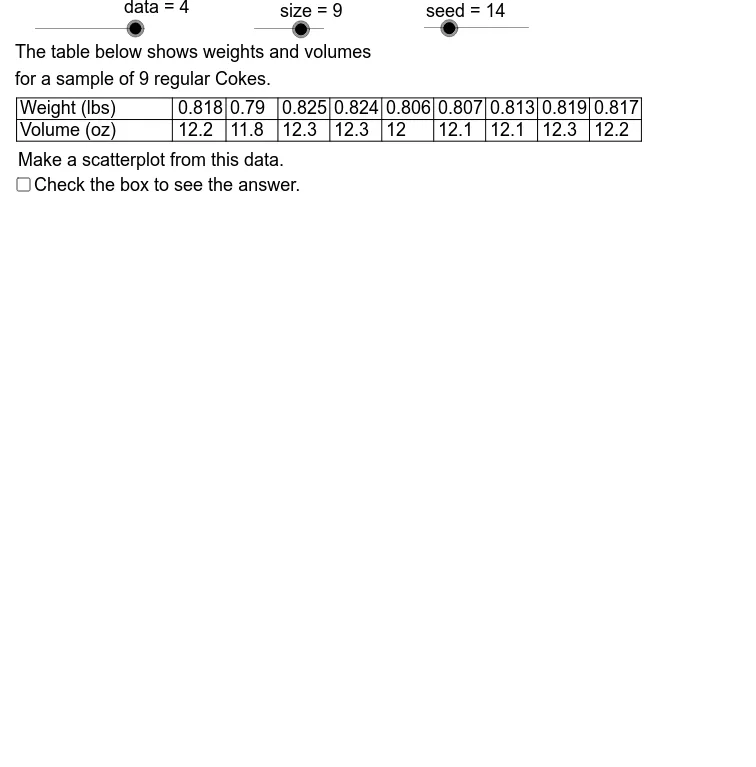
This applet demonstrates how to construct scatter diagrams and possible solutions. Key mathematical concepts include statistical data representation and analysis. Using GeoGebra commands such as Element, Sequence, Max, Min, etc., users can understand the construction points of scatter diagrams. Suitable for middle school and above students or teachers.
GeoGebra Commands & Parameters
Element(SmpRtSq, Mod[seed, 6] + 1) → SmpRtElement(DtXSq, data) → DtX1Sequence(Element[DtX1, Mod[Strt + k * SmpRt, 15] + 1], k, 0, size - 1) → DtX2Max(DtX2) → XMaxMin(DtX2) → XMinIf(5 * LBSX ≤ UBSX, 5 * LBSX, If[2 * LBSX ≤ UBSX, 2 * LBSX, LBSX]) → XSclElement(DtYSq, data) → DtY1Sequence(Element[DtY1, Mod[Strt + k * SmpRt, 15] + 1], k, 0, size - 1) → DtY2Min(DtY2) → YMinMax(DtY2) → YMaxSegment(Origin, HAE) → HAxSegment(Origin, VAE) → VAxIf(5 * LBSY ≤ UBSY, 5 * LBSY, If[2 * LBSY ≤ UBSY, 2 * LBSY, LBSY]) → YSclSequence(Text[k, (-3.5, AdpY(k) - 0.35)], k, YAxMn, YAxMx, YScl) → YLbsSequence(AdpX(Element[DtX2, k]), k, 1, size) → PltXSequence(AdpY(Element[DtY2, k]), k, 1, size) → PltYSequence((Element[PltX, k], Element[PltY, k]), k, 1, size) → DtPntsSegment(UL, UR) → TbTpSegment(ML, MR) → TBMdSegment(LL, LR) → TbBtSegment(LL, UL) → LeftSegment(LM, UM) → DatLeftSequence(Segment[(AdpX(k), GB - 0.5), (AdpX(k), GB + 0.5)], k, XAxMin, XAxMax, XScl) → XTcSequence(Text[k, (AdpX(k) - 1, GB - 2.5)], k, XAxMin, XAxMax, XScl) → XLbsSegment((GL - 1.414, GB - 1.414), (GL, GB)) → LLSgSequence(Segment[(GL - 0.5, AdpY(k)), (GL + 0.5, AdpY(k))], k, YAxMn, YAxMx, YScl) → YTcElement(XAxLbSq, data) → XAxLbElement(YAxLbSq, data) → YAxLbText(Element[XAxLbSq, data], (DtStr - 11.65, DtHgt - 1.9)) → XVlLbText(Element[YAxLbSq, data], (DtStr - 11.65, DtHgt - 4.4)) → YVlLbSequence(Segment[(DtStr + 6.2 + k * CW, DtHgt), (DtStr + 6.2 + k * CW, DtHgt - 5)], k, 1, size) → DvLnSequence(Text[Element[DtY2, k], (DtStr + 0.7 + CW * k, DtHgt - 4.4)], k, 1, size) → YDtTxtSequence(Text[Element[DtX2, k], (DtStr + 0.7 + CW * k, DtHgt - 1.9)], k, 1, size) → XDtTxtElement(DDSq, data) → DD
AI Drawing Prompt Reference
Create a scatter diagram to demonstrate the construction and analysis of statistical data. Draw the coordinate axes, label the scales and units, then plot data points as circles. Add grid lines and data labels to make the chart clear and easy to understand, suitable for educational purposes.
The prompt above was compiled from the original drawing commands and is for reference only.